
NAV as of 6/18/2026
$67.33
1 Day NAV Change as of 6/18/2026
$-0.07

| Symbol | Exchange | Inception Date | CUSIP | NAV | Options Available |
|---|---|---|---|---|---|
| CWS | NYSE Arca | 9/20/2016 | 00768Y560 | CWS.NV | Yes |
Why Invest in CWS?
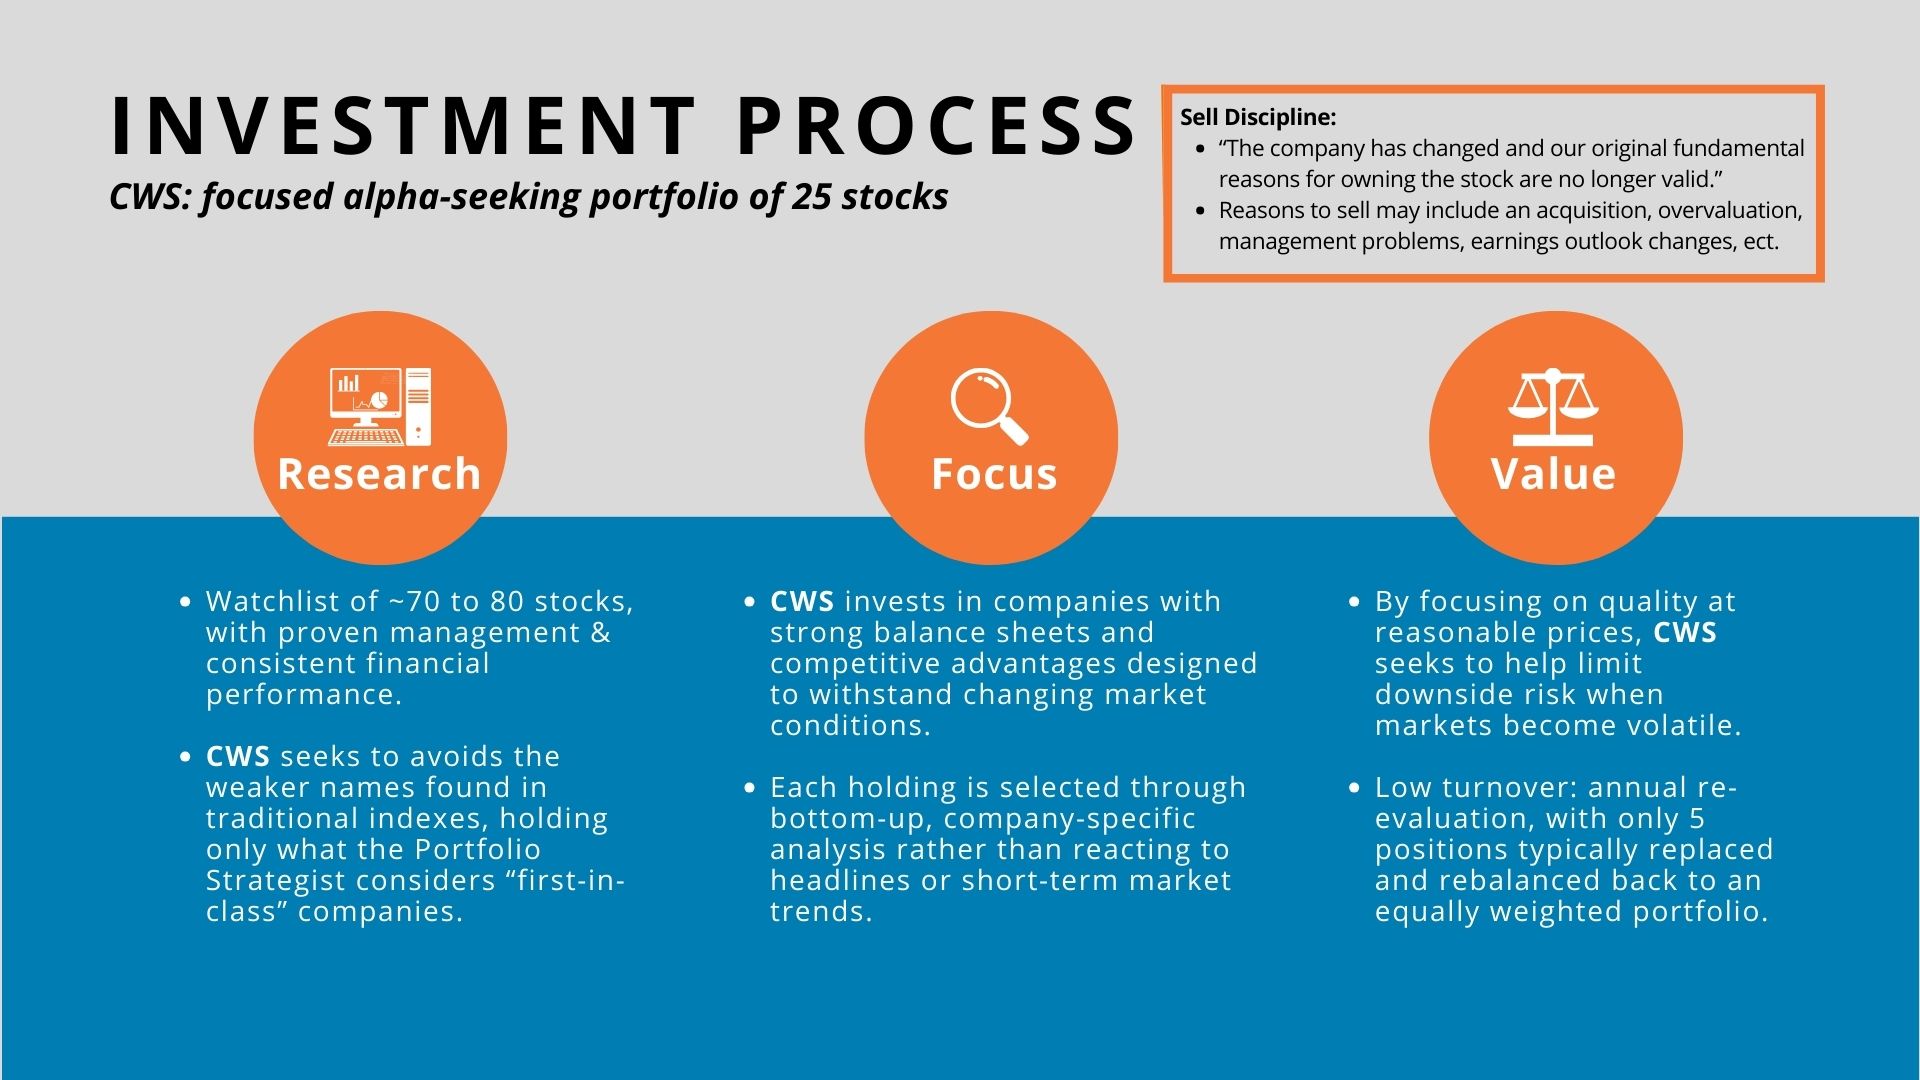
- Complement to any Broad-Based Index Fund — CWS’s strategy seeks to avoid the fundamentally weak companies that index-based funds generally hold and only invest in those perceived as “first in class” firms.
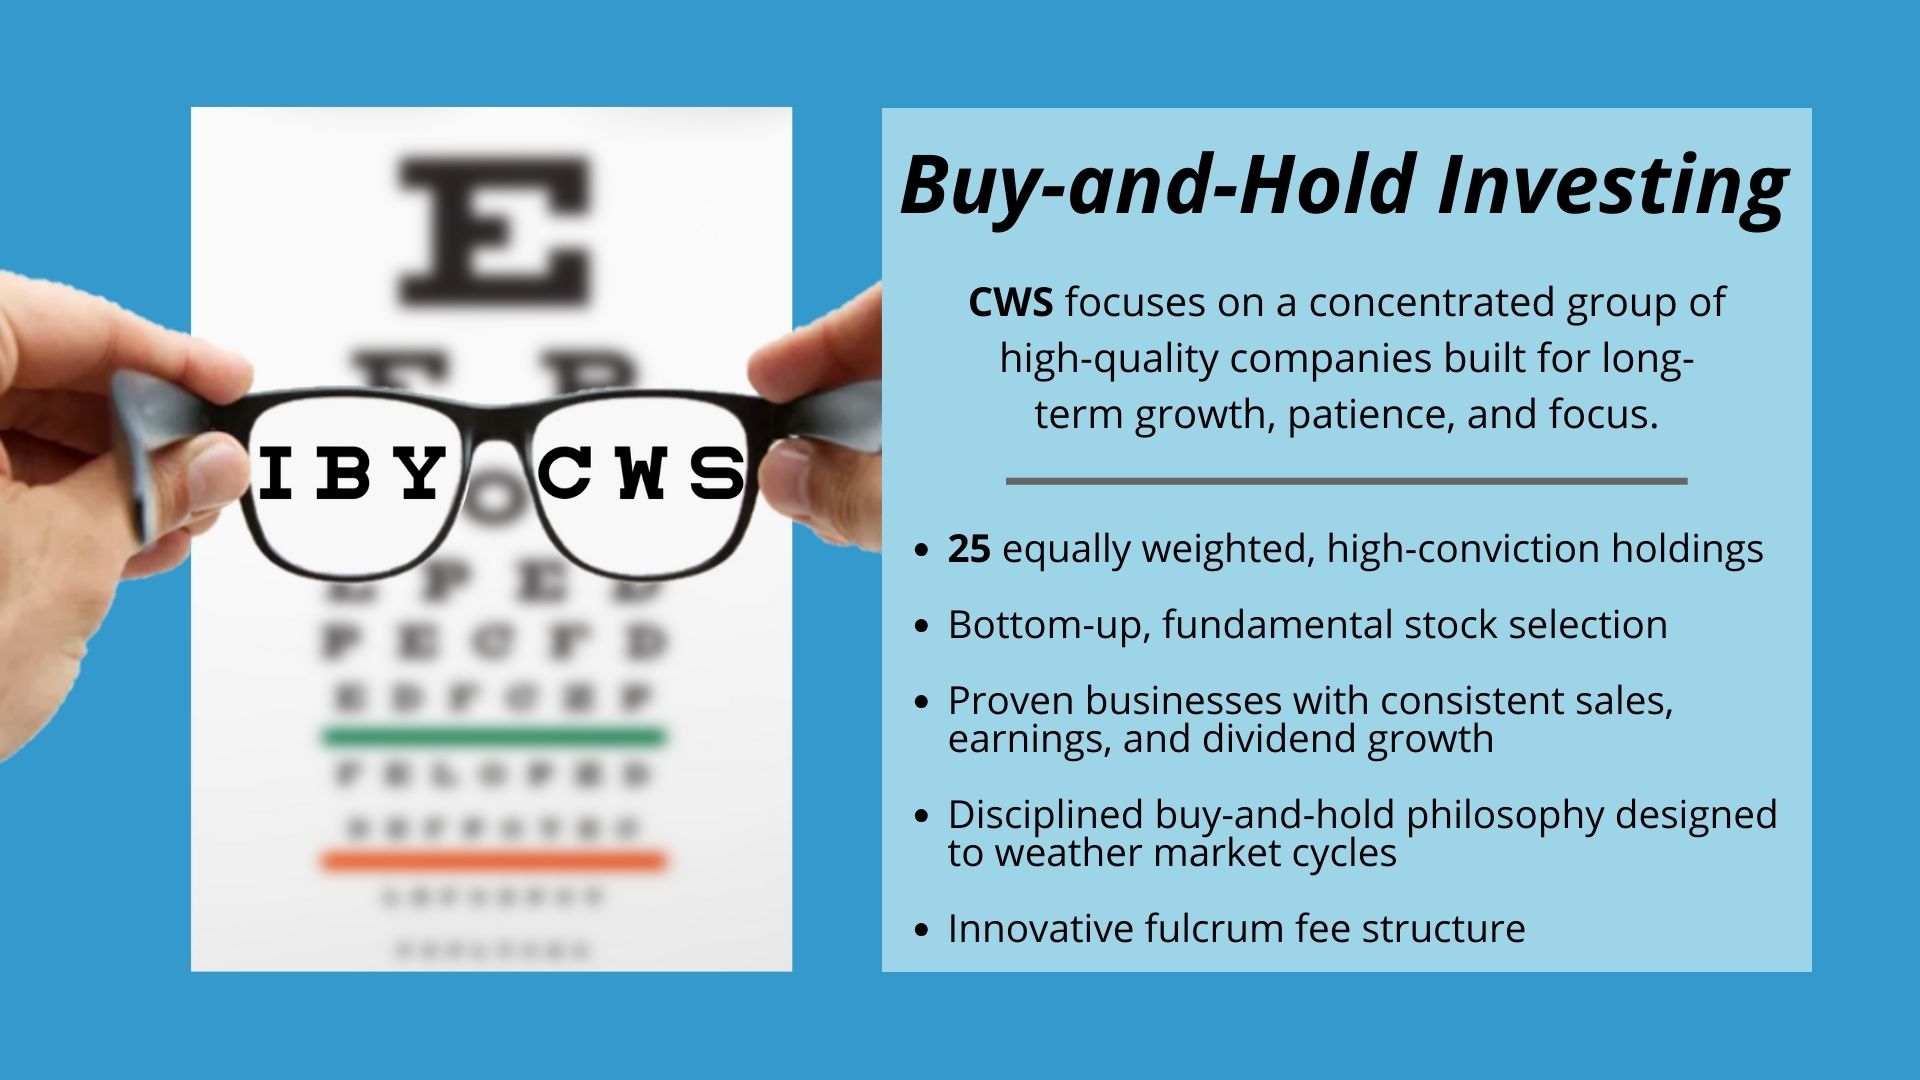
- Low Turnover — CWS’s strategy is focused on the long term. That’s why CWS aims for a buy-and-hold strategy, trading as infrequently as possible and holding for as long as it can. CWS believes that a disciplined buy-and-hold strategy is ideal for riding out market storms.
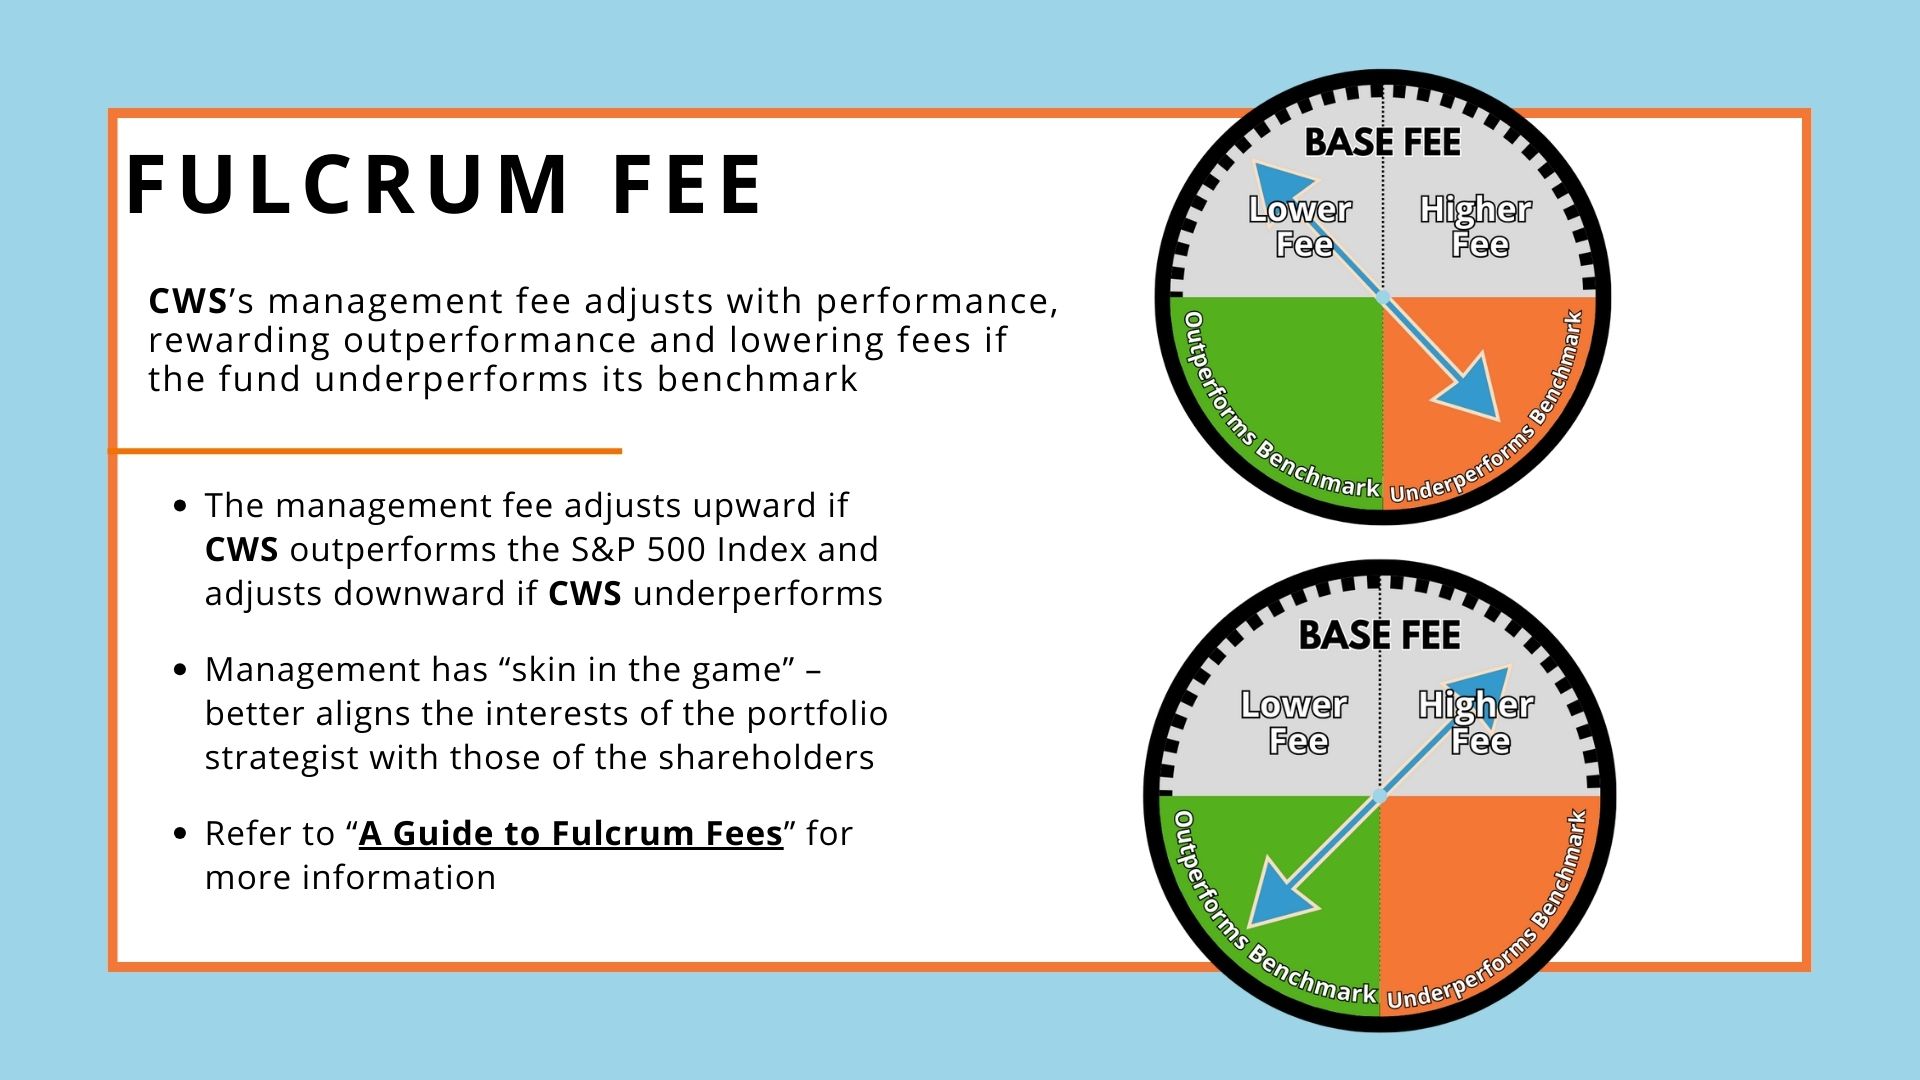
- Innovative Fulcrum Fee Structure — CWS’s Portfolio Strategist’s manager fee is directly tied to performance: outperformance is rewarded with a larger management fee; underperformance is penalized with a smaller management fee.
- Disciplined Alpha Seeking Strategy — CWS is focused on a core group of what we believe are outstanding firms, offering investors a simple way to get instant exposure to a concentrated equity portfolio of companies with proven competitive advantages.
Where Can CWS Fit in a Traditional Portfolio?
As a potential source of alpha, CWS can serve as a complement to or a satellite equity holding alongside a broadly based domestic equity position.
Key Attributes
- Concentrated Portfolio – CWS typically holds 25 stocks. By focusing on a small group of high-quality companies, the Portfolio Strategist feels that the portfolio can most efficiently exploit the advantages of owning top-tier companies.
- Consistent Time-Tested Strategy – CWS’s principal investment strategy – holding a portfolio of 25 stocks representing the Portfolio Strategist’s highest conviction stock ideas – has been in place since 2006. A central concept to CWS’s strategy is quality companies can outperform the broad market especially when implemented with a long term, disciplined focus.
- Bottom Up, Fundamental Stock Selection – CWS seeks to benefit from investing in the highest-quality companies. These are typically firms with proven management, solid balance sheets, competitive economic advantages, strong market niches, and a long history of steadily increasing sales, earnings, and dividends.
- Disciplined and Patient Approach – The Portfolio Strategist understands that stock prices are much more volatile than their underlying fundamentals. That’s why CWS takes a long-term view. With longer holding periods, CWS seeks to benefit from the market’s tendency to overreact to any sign of trouble.
- Value Focus – CWS strives to uncover hidden value and to buy the highest-quality stocks at the lowest possible prices. By focusing on value, CWS aims to reduce its risk to broad-based market drops while aiding in long-term capital appreciation.
About the Portfolio Strategist
Eddy J. Elfenbein
“Eddy” Elfenbein has been a leading writer in the financial community since starting the Crossing Wall Street (CWS) website and the CWS “Buy List” in 2005 and 2006, respectively. He has been widely quoted in the business and financial media, including Barron’s and the Wall Street Journal. Mr. Elfenbein often appears on CNBC and Bloomberg, where he shares his insights on the market and the economy. He also authors the weekly “CWS Market Review” and the monthly “Growth Stock Advisor” newsletters. Mr. Elfenbein earned his undergraduate degree from Washington College and an MBA in Finance and Management from the University of Connecticut.


CWS Overview from Eddy J. Elfenbein
Get an introduction to the CWS ETF directly from the portfolio strategist, Eddy J. Elfenbein.
CWS Overview from Eddy J. Elfenbein
Get an introduction to the CWS ETF directly from the portfolio manager, Eddy J. Elfenbein.
Fund
Price History
Fund Data
6/18/2026| NAV | $67.33 |
| Change | $-0.07 |
| Shares Outstanding | 1,940,000 |
| Assets Under Management | $130,620,700.68 |
Market Data
6/18/2026| Closing Price | $67.21 |
| Close Change | $-0.15 |
| Volume | 2,404 |
Regulatory Data
6/17/2026| Premium Discount | $0.03 |
| 30-Day Median bid-ask Spread | 0.202634 |
Shares are bought and sold at market price (closing price) not NAV and are not individually redeemed from the Fund. Market price returns are based on the midpoint of the bid/ask spread at 4:00 pm Eastern Time (when NAV is normally determined), and do not represent the return you would receive if you traded at other times.
")
FUND
Characteristics
As of 5/31/2026
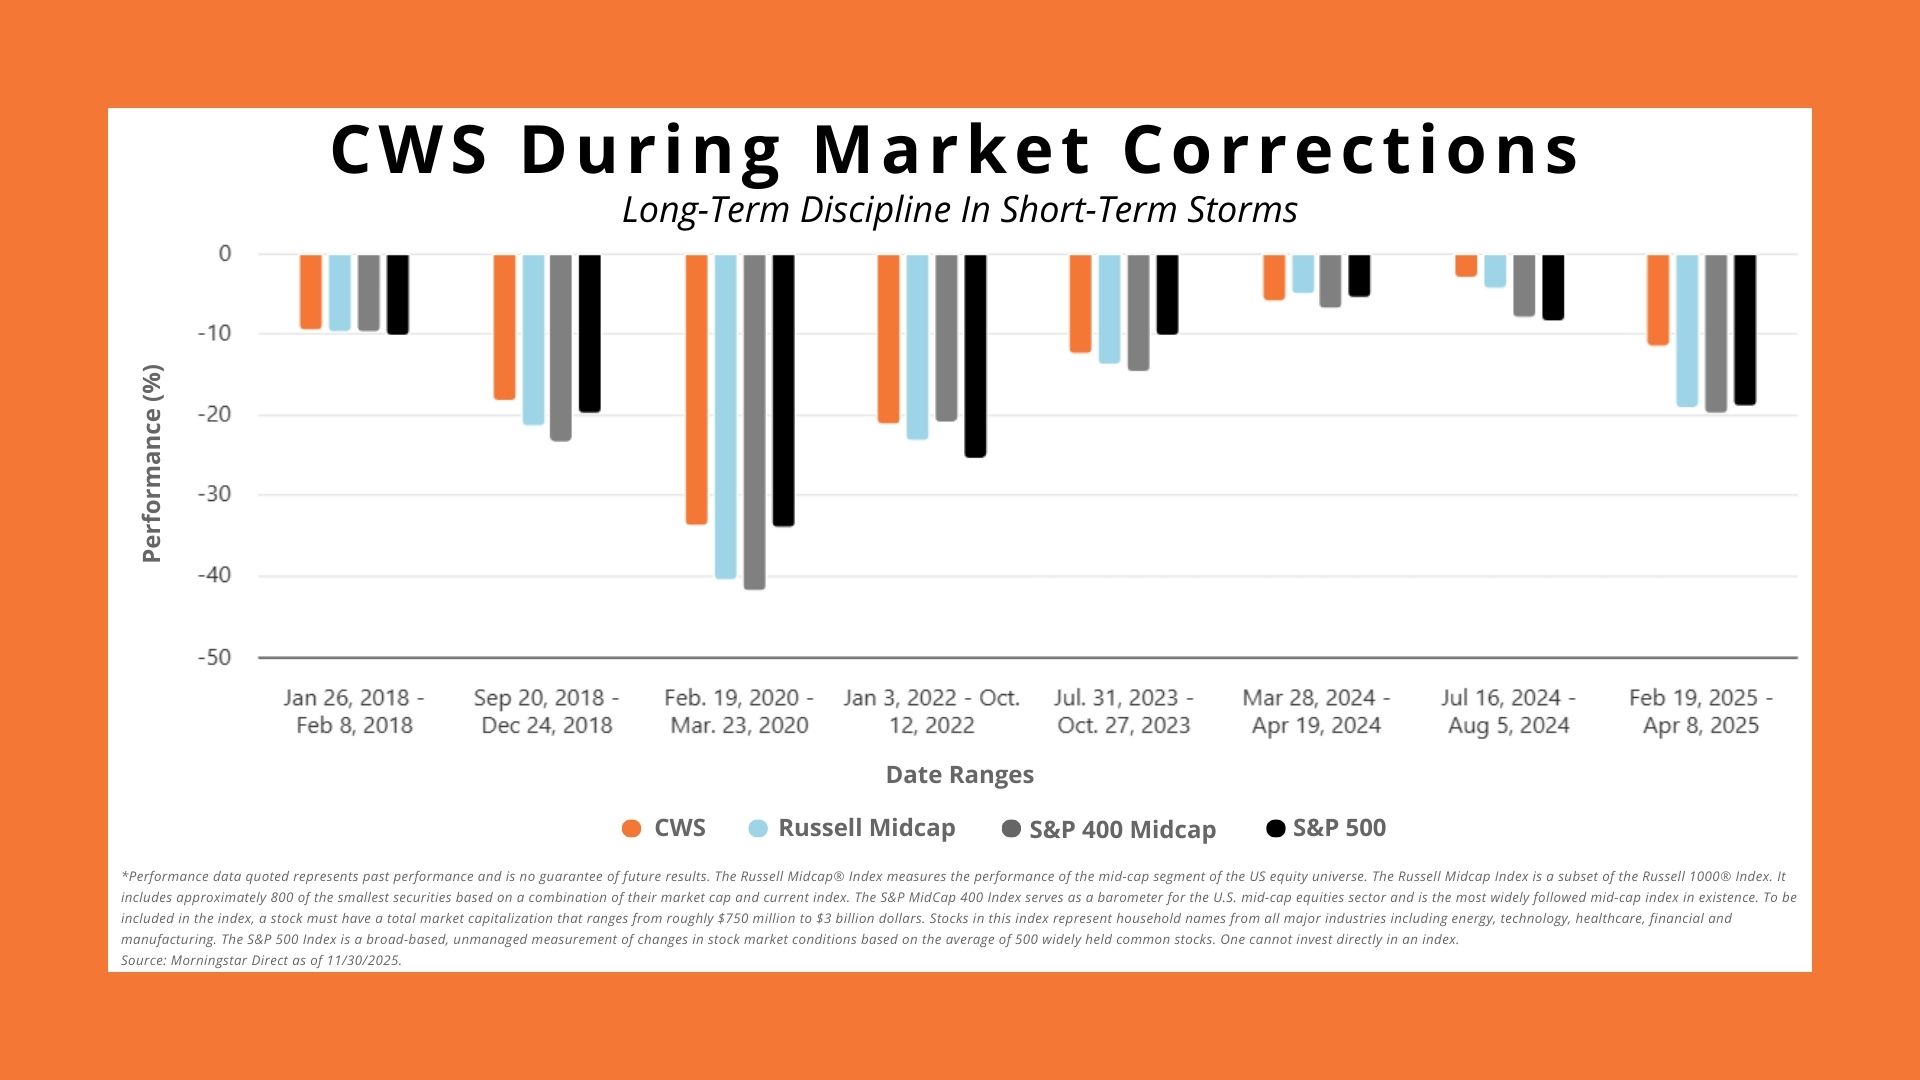
*Performance data quoted represents past performance and is no guarantee of future results. The Russell Midcap® Index measures the performance of the mid-cap segment of the US equity universe. The Russell Midcap Index is a subset of the Russell 1000® Index. It includes approximately 800 of the smallest securities based on a combination of their market cap and current index. The S&P MidCap 400 Index serves as a barometer for the U.S. mid-cap equities sector and is the most widely followed mid-cap index in existence. To be included in the index, a stock must have a total market capitalization that ranges from roughly $750 million to $3 billion dollars. Stocks in this index represent household names from all major industries including energy, technology, healthcare, financial and manufacturing. The S&P 500 Index is a broad-based, unmanaged measurement of changes in stock market conditions based on the average of 500 widely held common stocks. One cannot invest directly in an index.
Source: Morningstar & AdvisorShares *A fulcrum fee is a type of management fee that can go up or down based on the performance of the ETF as compared to a similar benchmark index. For more information please read the full prospectus or read more about fulcrum fees below.
FUND
Performance
As of 5/31/2026
| NAV | Market Price Return | S&P 500 Index | |
|---|---|---|---|
| 1 Month | -1.53 | -1.55 | 5.26 |
| 3 Months | -3.34 | -3.32 | 10.52 |
| YTD | -1.66 | -1.68 | 11.27 |
| 1 Year | -0.92 | -0.85 | 29.78 |
| 3 Years | 11.84 | 11.79 | 23.61 |
| 5 Years | 8.13 | 8.13 | 14.15 |
| Since Inception (9/20/2016, Annualized) | 11.41 | 11.41 | 15.86 |
As of 3/31/2026
| NAV | Market Price Return | S&P 500 Index | |
|---|---|---|---|
| 1 Month | -7.24 | -7.32 | -4.98 |
| 3 Months | -5.62 | -5.74 | -4.33 |
| YTD | -5.62 | -5.74 | -4.33 |
| 1 Year | -0.70 | -0.62 | 17.80 |
| 3 Years | 8.98 | 8.80 | 18.32 |
| 5 Years | 8.19 | 8.08 | 12.06 |
| Since Inception (9/20/2016, Annualized) | 11.14 | 11.13 | 14.33 |
Performance data quoted represents past performance and is no guarantee of future results. All Fund data and performance data quoted is believed to be accurate, and unless otherwise stated, is sourced from the Fund administrator, the Advisor’s or Sub-Advisor’s proprietary data, and Morningstar. Current performance may be lower or higher than the performance data quoted. Investment return and principal value will fluctuate so that an investor’s shares, when redeemed, may be worth more or less than original cost. Returns less than one year are not annualized.
The S&P 500 Index is a broad-based, unmanaged measurement of changes in stock market conditions based on the average of 500 widely held common stocks. One cannot invest directly in an index.
Get Social @AdvisorShares
Join the conversation on social media to hear more from the portfolio manager, get informed about upcoming events and webinars, and more!
| Date | Account Symbol | Stock Ticker | Security ID | Security Description | Shares | Share Price | Market Value | Portfolio Weight | Asset Group |
|---|---|---|---|---|---|---|---|---|---|
| 06/18/2026 | CWS | FIX | 199908104 | COMFORT SYSTEMS USA INC | 5,723 | 1,967.41 | 11,259,487.43 | 8.62% | S |
| IESC | 44951W106 | IES HOLDINGS INC | 13,474 | 712.39 | 9,598,742.86 | 7.35% | S | ||
| CASY | 147528103 | CASEY'S GENERAL STORES INC | 9,560 | 842.25 | 8,051,910.00 | 6.16% | S | ||
| APH | 032095101 | AMPHENOL CORP-CL A | 39,399 | 163.96 | 6,459,860.04 | 4.95% | S | ||
| ALSN | 01973R101 | ALLISON TRANSMISSION HOLDING | 53,786 | 119.10 | 6,405,912.60 | 4.90% | S | ||
| MLI | 624756102 | MUELLER INDUSTRIES INC | 45,697 | 137.39 | 6,278,310.83 | 4.81% | S | ||
| HSIC | 806407102 | HENRY SCHEIN INC | 70,401 | 79.92 | 5,626,447.92 | 4.31% | S | ||
| HEI | 422806109 | HEICO CORP | 16,234 | 337.10 | 5,472,481.40 | 4.19% | S | ||
| SFM | 85208M102 | SPROUTS FARMERS MARKET INC | 67,688 | 80.49 | 5,448,207.12 | 4.17% | S | ||
| SAIC | 808625107 | SCIENCE APPLICATIONS INTE | 52,487 | 102.39 | 5,374,143.93 | 4.11% | S | ||
| AWK | 030420103 | AMERICAN WATER WORKS CO INC | 40,741 | 125.07 | 5,095,476.87 | 3.90% | S | ||
| MCK | 58155Q103 | MCKESSON CORP | 6,519 | 750.63 | 4,893,356.97 | 3.75% | S | ||
| MCO | 615369105 | MOODY'S CORP | 10,722 | 450.67 | 4,832,083.74 | 3.70% | S | ||
| SYK | 863667101 | STRYKER CORP | 15,200 | 307.80 | 4,678,560.00 | 3.58% | S | ||
| ICE | 45866F104 | INTERCONTINENTAL EXCHANGE IN | 32,945 | 133.88 | 4,410,676.60 | 3.38% | S | ||
| TMO | 883556102 | THERMO FISHER SCIENTIFIC INC | 9,304 | 464.61 | 4,322,731.44 | 3.31% | S | ||
| COR | 03073E105 | CENCORA INC | 15,800 | 271.83 | 4,294,914.00 | 3.29% | S | ||
| RMD | 761152107 | RESMED INC | 22,099 | 188.63 | 4,168,534.37 | 3.19% | S | ||
| FDS | 303075105 | FACTSET RESEARCH SYSTEMS INC | 18,482 | 221.29 | 4,089,881.78 | 3.13% | S | ||
| ROL | 775711104 | ROLLINS INC | 88,707 | 44.96 | 3,988,266.72 | 3.05% | S | ||
| ABT | 002824100 | ABBOTT LABORATORIES | 43,046 | 88.41 | 3,805,696.86 | 2.91% | S | ||
| FICO | 303250104 | FAIR ISAAC CORP | 3,106 | 1,096.48 | 3,405,666.88 | 2.61% | S | ||
| BR | 11133T103 | BROADRIDGE FINANCIAL SOLUTIO | 23,589 | 137.60 | 3,245,846.40 | 2.48% | S | ||
| ADBE | 00724F101 | ADOBE INC | 15,264 | 195.16 | 2,978,922.24 | 2.28% | S | ||
| INTU | 461202103 | INTUIT INC | 8,005 | 267.00 | 2,137,335.00 | 1.64% | S | ||
| X9USDBLYT | BLACKROCK TREASURY TRUST INSTL 62 | 382,153.84 | 1.00 | 382,153.84 | 0.29% | MM | |||
| CASH | -87,196.29 | 100.00 | -87,196.29 | -0.07% | CA |
FUND
Documents
FUND
Fees & Expenses
Annual Fund Operating Expenses (expenses that you pay each year as a percentage of the value of your investment)
| Management Fee* | 0.65% | |
| Other Expenses | 0.14% | |
| Gross Expense Ratio | 0.79% | |
| Fee Waiver/Expense Reimbursement* | -0.14% | |
| Net Expense Ratio | 0.65% |
| Expense Cap Limitation* | 0.75% |
*The base management fee is 0.75%, which may adjust up or down by up to 0.10% based on the Fund’s performance relative to the S&P 500 Index; therefore, the management fee can range from 0.65% to 0.85%.The Advisor has contractually agreed to reduce its fees and/or reimburse expenses to keep net expenses from exceeding a percentage of the Fund’s average daily net assets equal to the annual rate of the management fee which can range from 0.65% to 0.85% for at least one year from the date of the Prospectus. For more information, please read the full prospectus.
Last Ten
Fund Distributions
")
- Before investing you should carefully consider the Fund’s investment objectives, risks, charges and expenses. This and other information is in the prospectus, a copy of which may be obtained by visiting the Fund’s website at www.AdvisorShares.com. Please read the prospectus carefully before you invest. Foreside Fund Services, LLC, Distributor.
- There is no guarantee that the Fund will achieve its investment objective. An investment in the Fund is subject to risk, including the possible loss of principal amount invested. The prices of equity securities rise and fall daily. These price movements may result from factors affecting individual issuers, industries or the stock market as a whole. Shares of the Fund may trade above or below their net asset value (“NAV”). The trading price of the Fund’s shares may deviate significantly from their NAV during periods of market volatility. There can be no assurance that an active trading market for the Fund’s shares will develop or be maintained. In addition, equity markets tend to move in cycles which may cause stock prices to fall over short or extended periods of time. Other Fund risks include market risk, liquidity risk, large cap, mid cap, and small cap risk. Please see prospectus for details regarding risk.
- Definitions
- Alpha, one of the most commonly quoted indicators of investment performance, is defined as the excess return on an investment relative to the return on a benchmark index
ETF
Social
Conversation