
NAV as of 6/5/2026
$32.72
1 Day NAV Change as of 6/5/2026
$0.04
| Symbol | Exchange | Inception Date | CUSIP | NAV | Options Available |
|---|---|---|---|---|---|
| VICE | NYSE Arca | 12/11/2017 | 00768Y545 | VICE.NV | Yes |
What Does VICE Invest In?
What Does VICE Invest In?
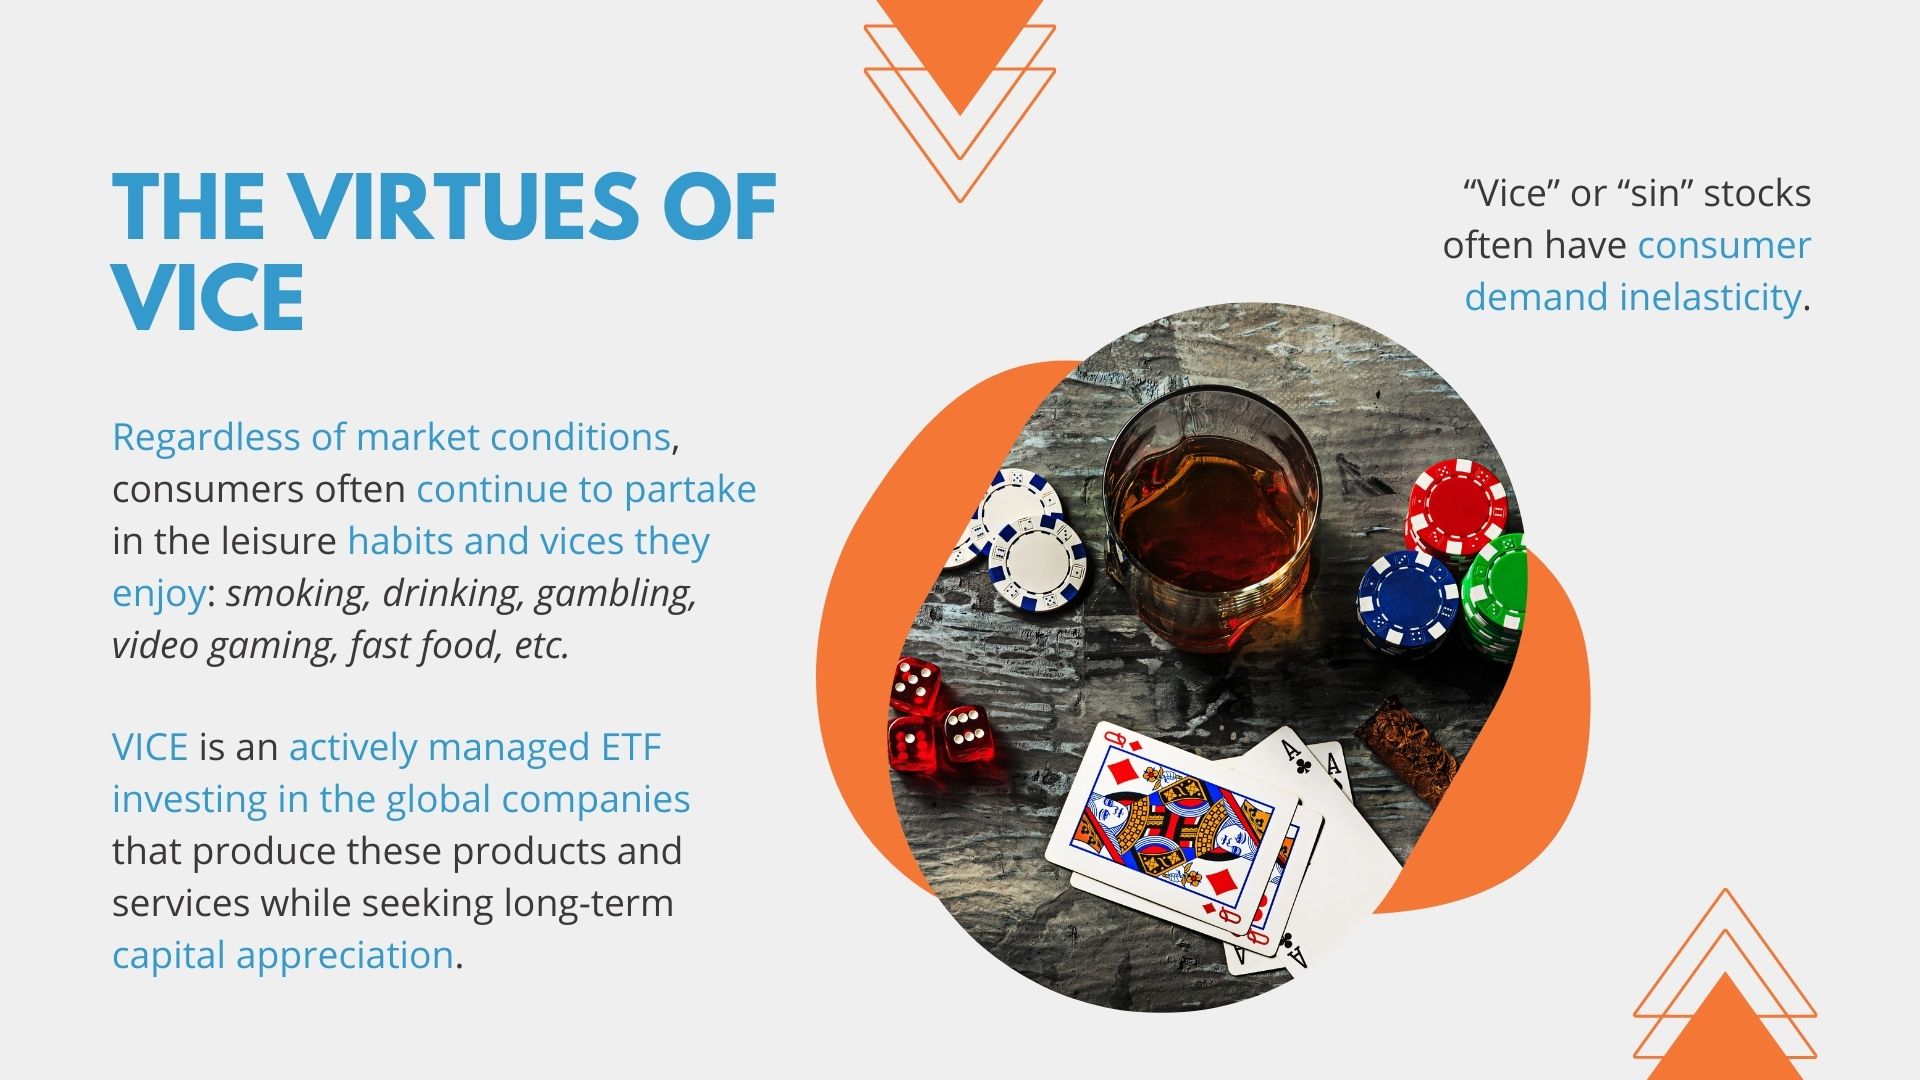
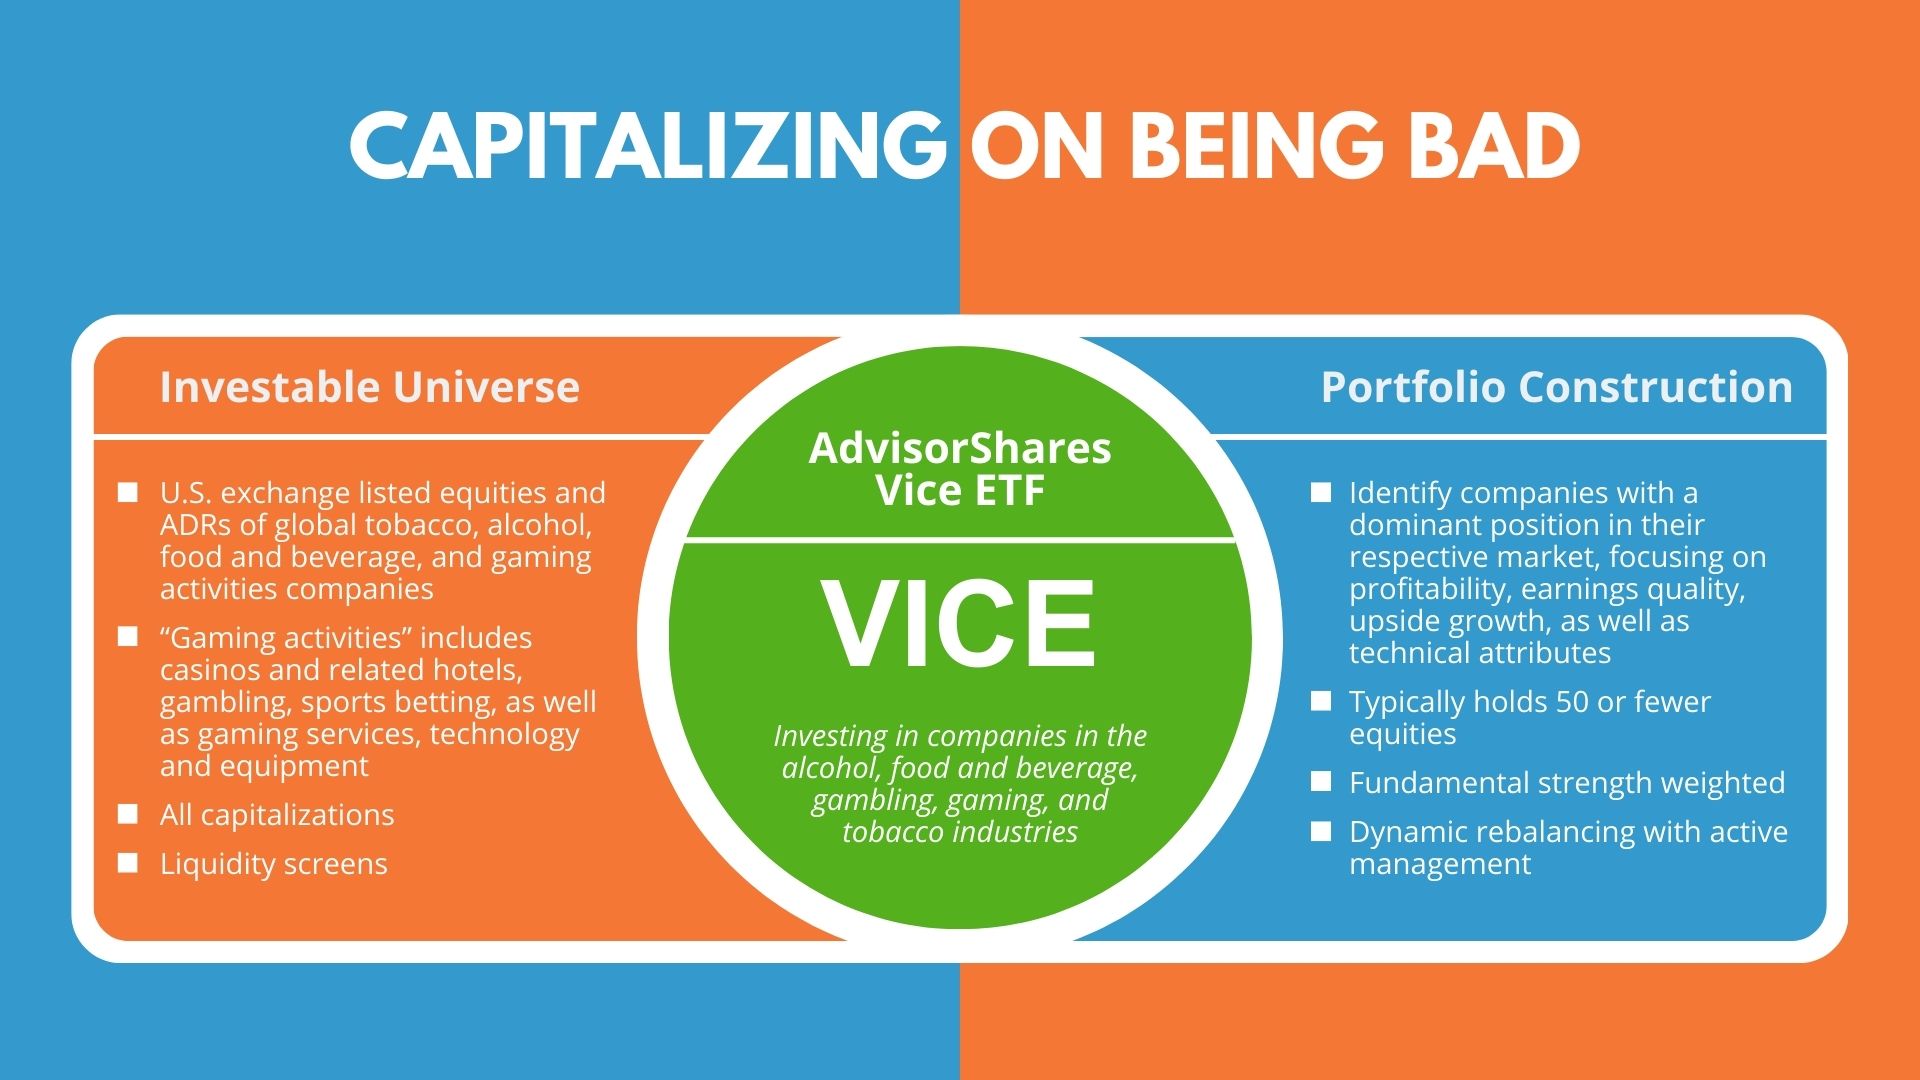
The AdvisorShares Vice ETF (ticker: VICE) invests in the products and services that people find pleasure in regardless of economic conditions. VICE seeks long-term growth from select global companies operating in “vice” industries which can include alcohol, tobacco, gaming, food and beverage, restaurant and hospitality, or other vice related business activities.
Why Invest in VICE?
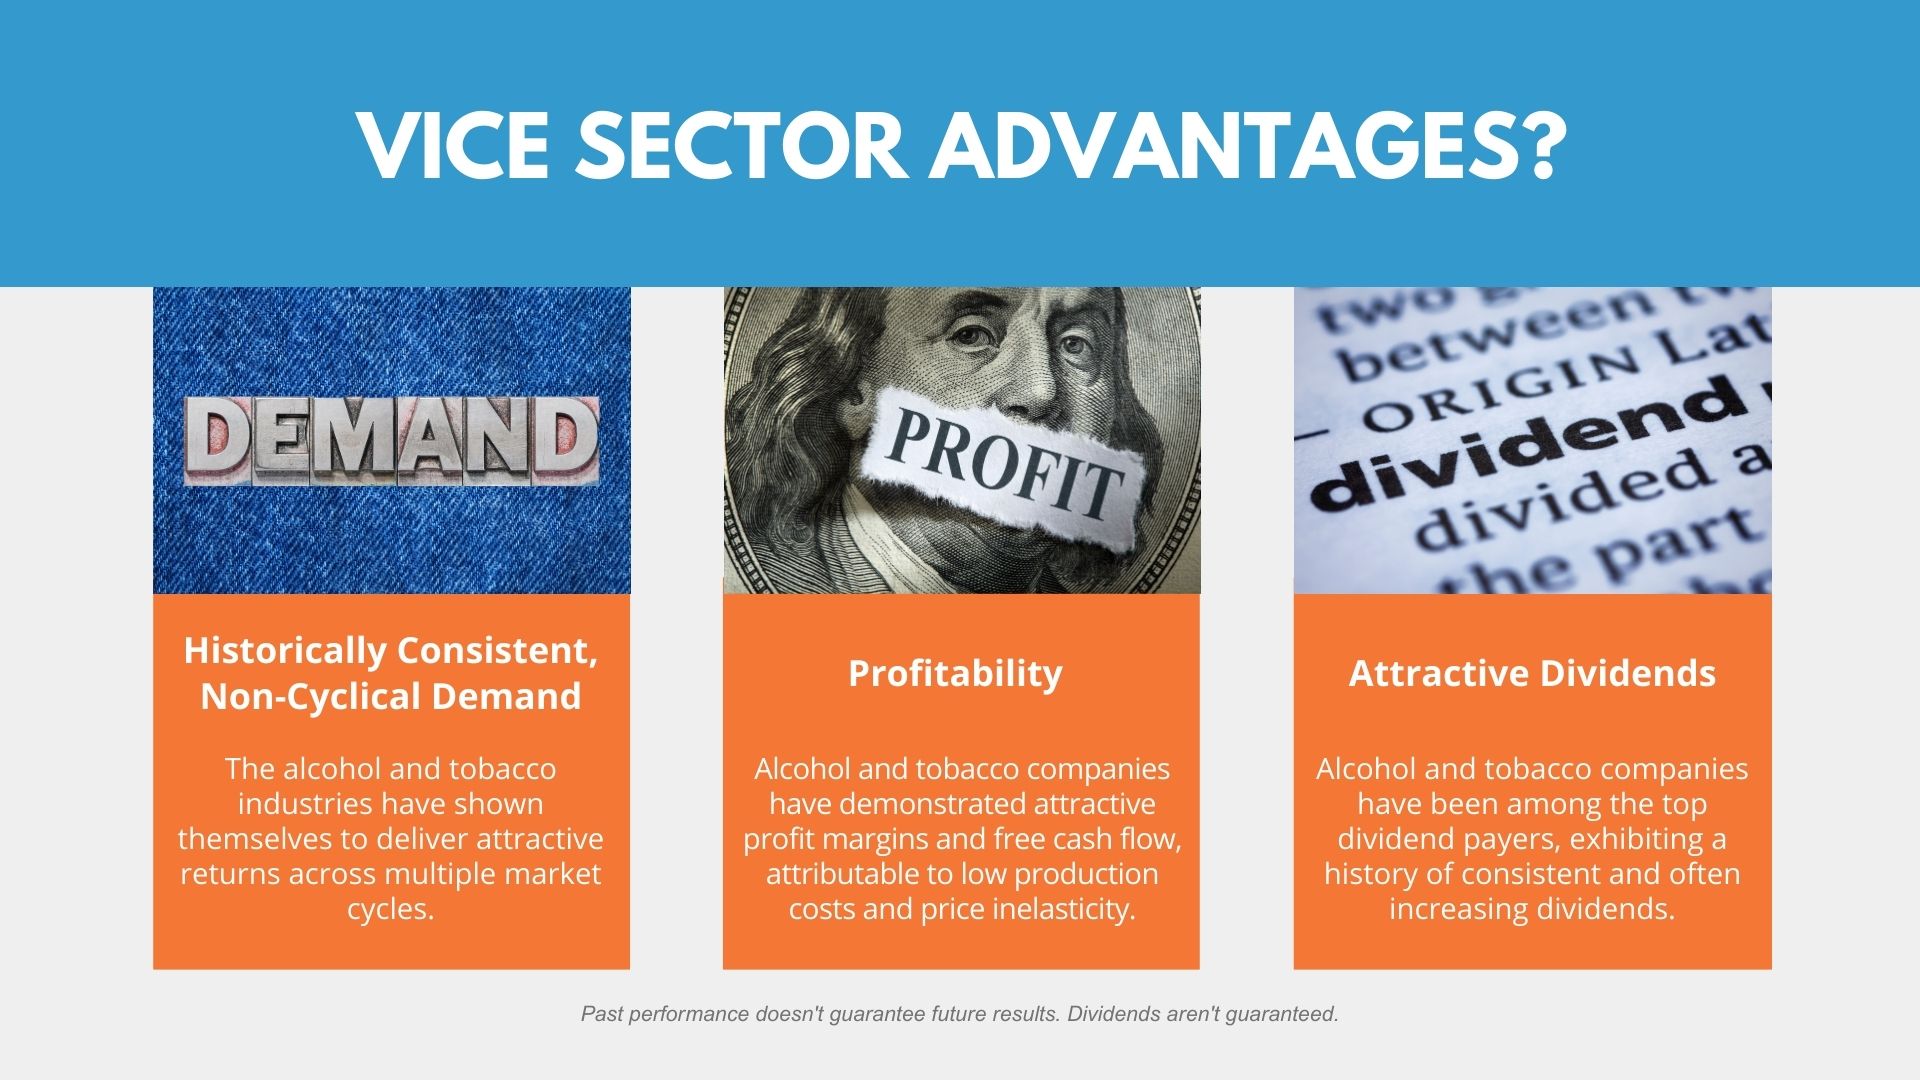
- Historically Consistent, Non-Cyclical Demand – Regardless of market conditions, we believe consumers will continue to partake in the leisure habits and vices they enjoy. Additionally, products produced by vice companies tend to have greater price inelasticity and brand loyalty than other more commoditized products and services, allowing them to withstand price increases more readily. Historically, the alcohol and tobacco industries have shown themselves to be recession-resistant, delivering attractive returns across multiple market cycles.
- Attractive Profit Margins – Despite reduced smoking habits and heavily restrictive marketing, tobacco companies possess some of the highest profit margins within the consumer products sector, while alcohol-related companies are also known for competitive profit margins.
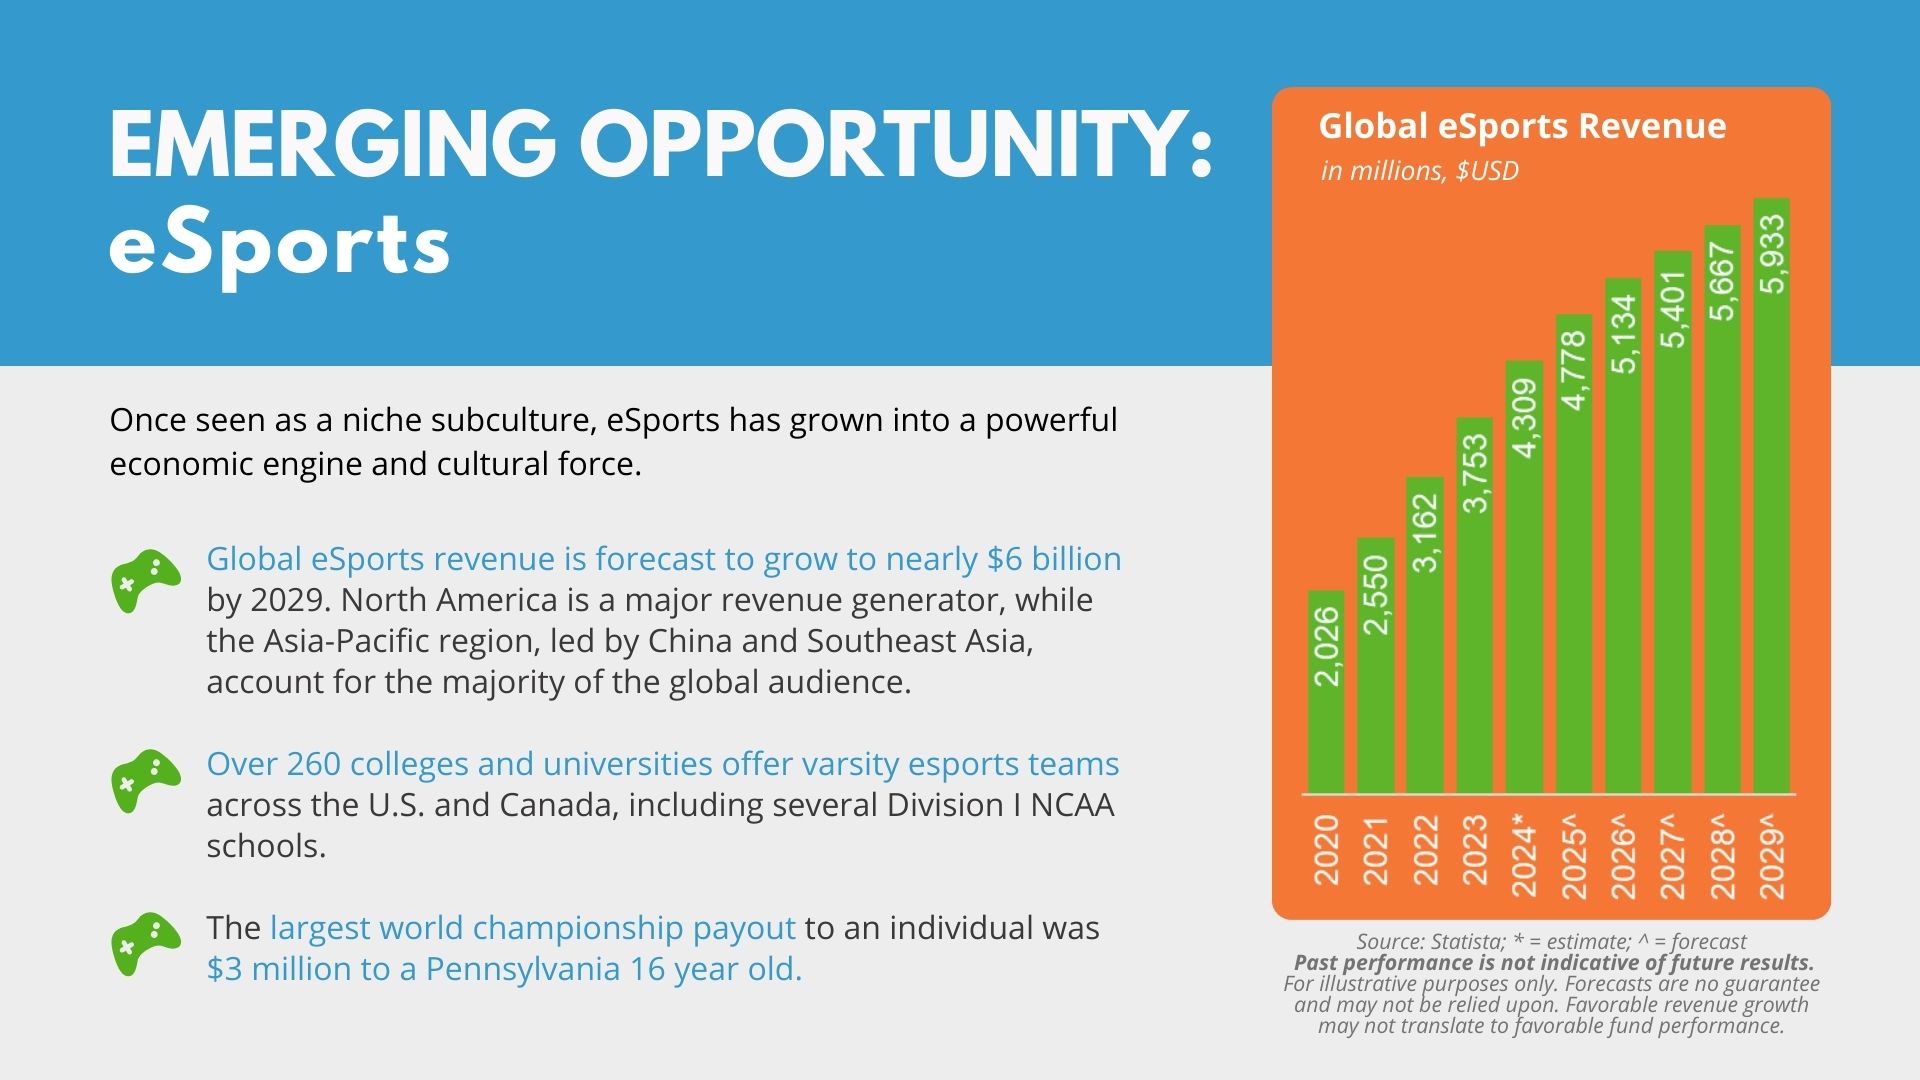
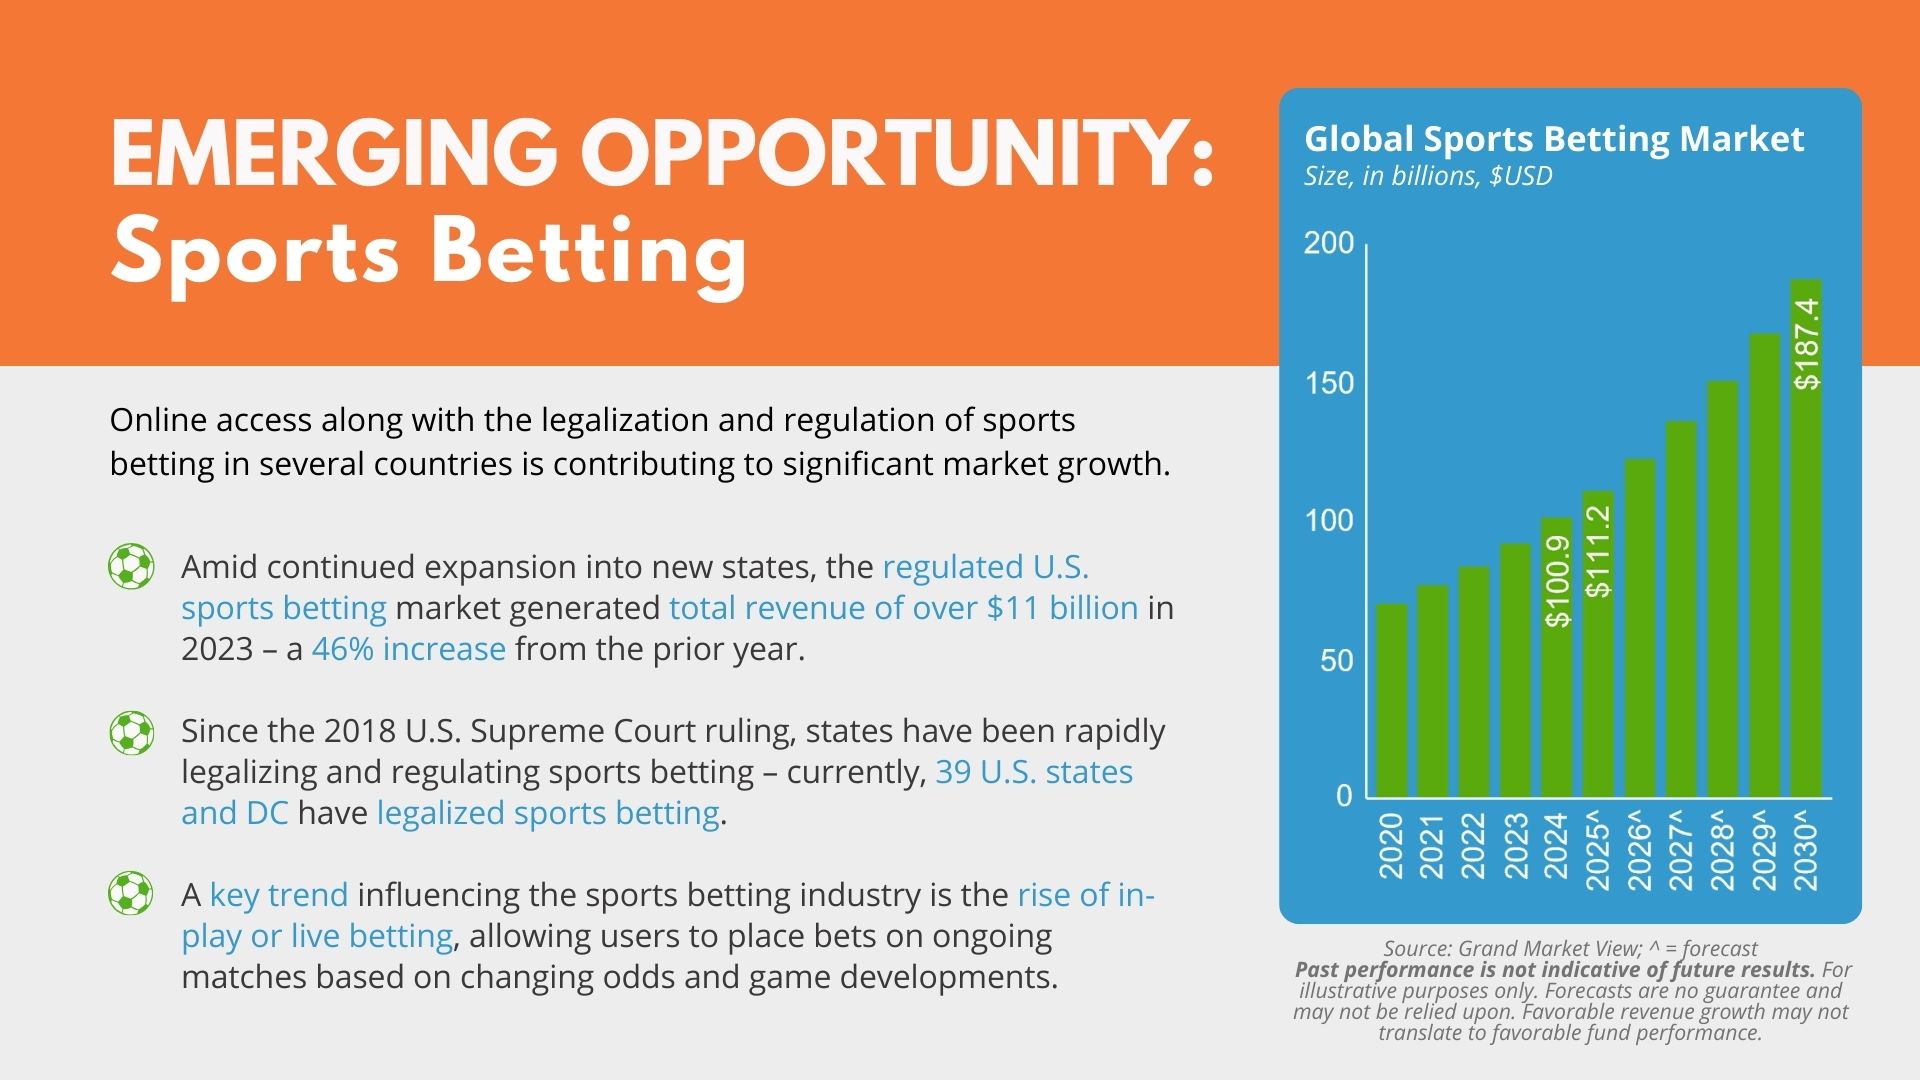
- Emerging Vice Industries – With an improving regulatory environment, gaming companies are positioned to expand their traditional gambling goods and services in new ways and to new consumers. There is potential for merger and acquisition activity as larger companies look to enter these new markets. Some emerging vice areas include online gaming, sports betting, e-sports.
- Only ETF with Exposure to Multiple Vice Industries – VICE is the only ETF providing exposure to multiple diversified vice industries, including alcohol, gaming, and tobacco, rather than just one. The fully transparent ETF structure of VICE delivers intraday liquidity as well as operational and tax efficiency for its shareholders.
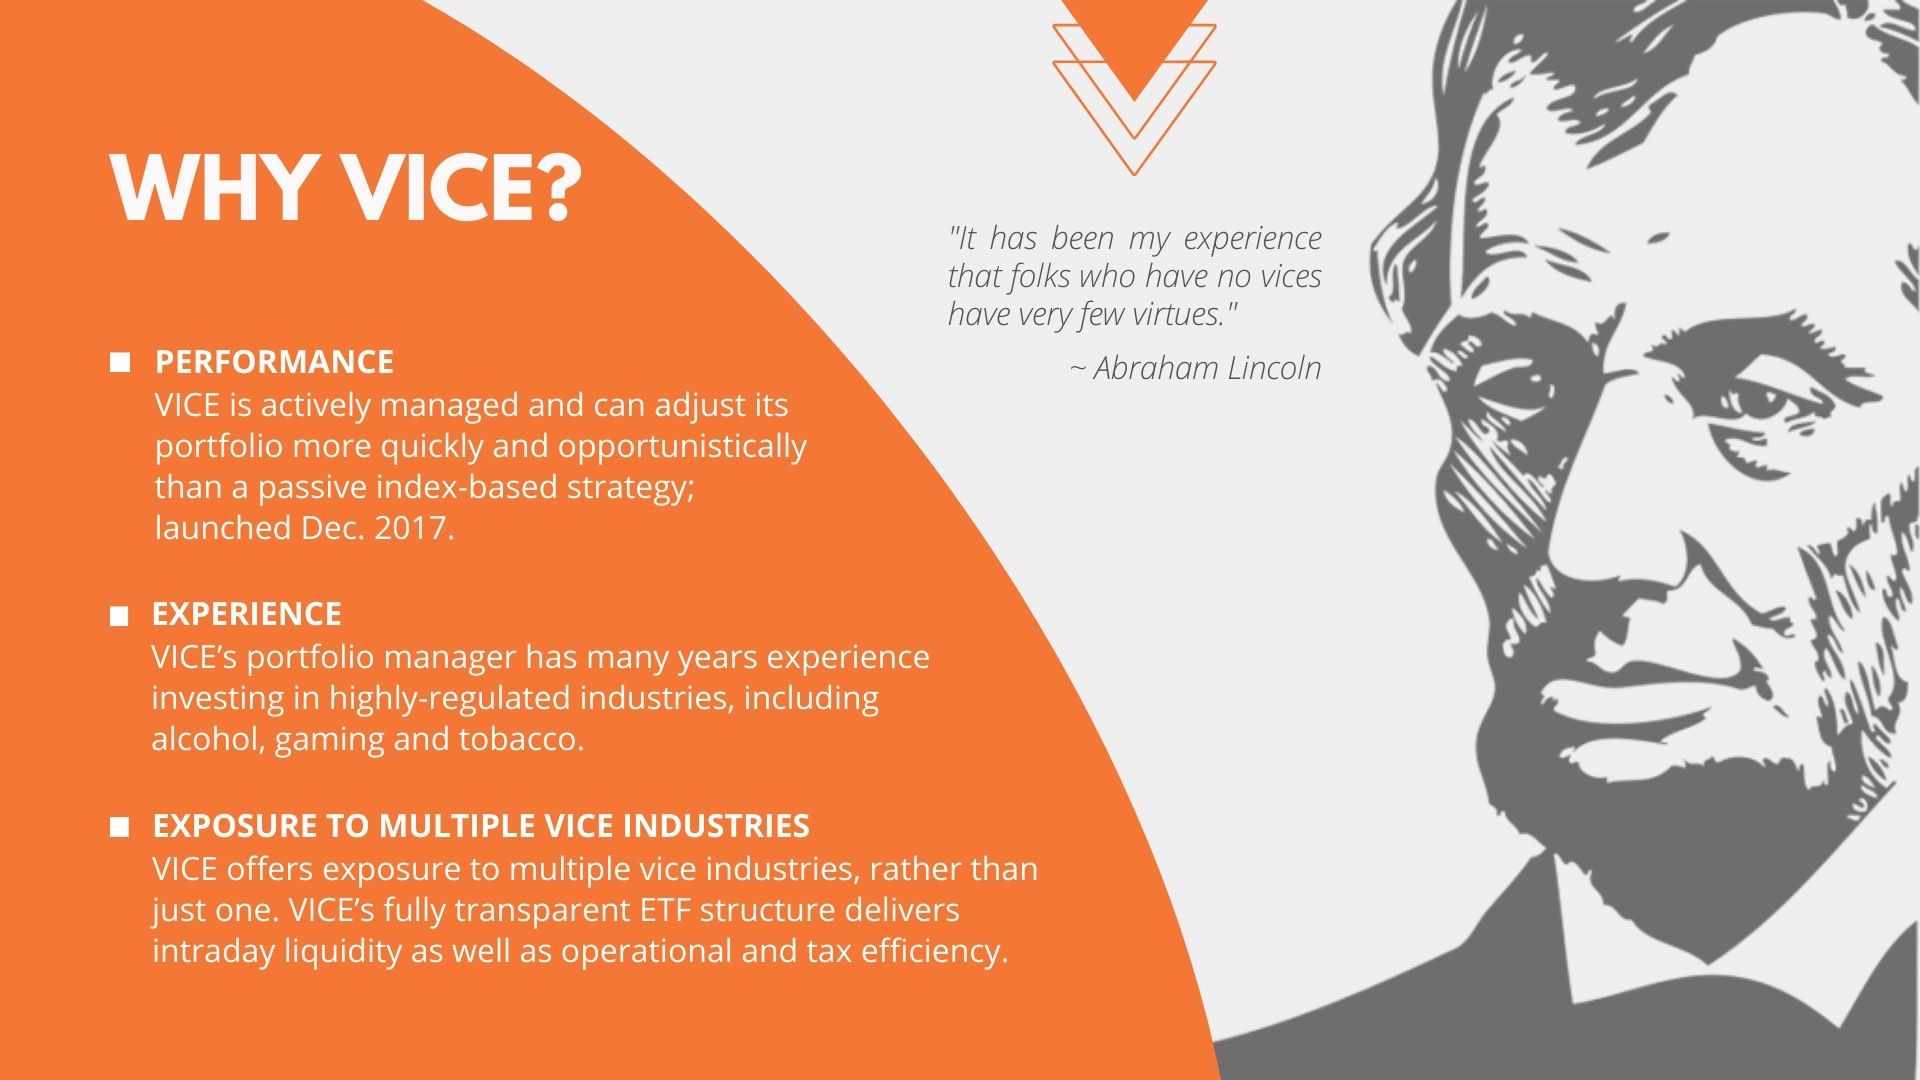
- Active and Experienced Management – VICE is actively managed, allowing the portfolio to be adjusted more quickly and opportunistically than a passive index-based strategy. VICE’s portfolio manager, Dan Ahrens, has deep experience in the capital markets and well-established expertise investing in highly-regulated industries including alcohol, cannabis, gaming and tobacco.
Where Can VICE Fit in a Traditional Portfolio?
VICE can serve as an alpha-seeking complement or satellite equity holding to a broad-based equity allocation.
Because it is actively managed, VICE can adapt as markets evolve – whether it be from the growing legalization of gambling, the emergence of e-sports, the spread of sports betting, or other vice-related consumer trends.
Key Attributes
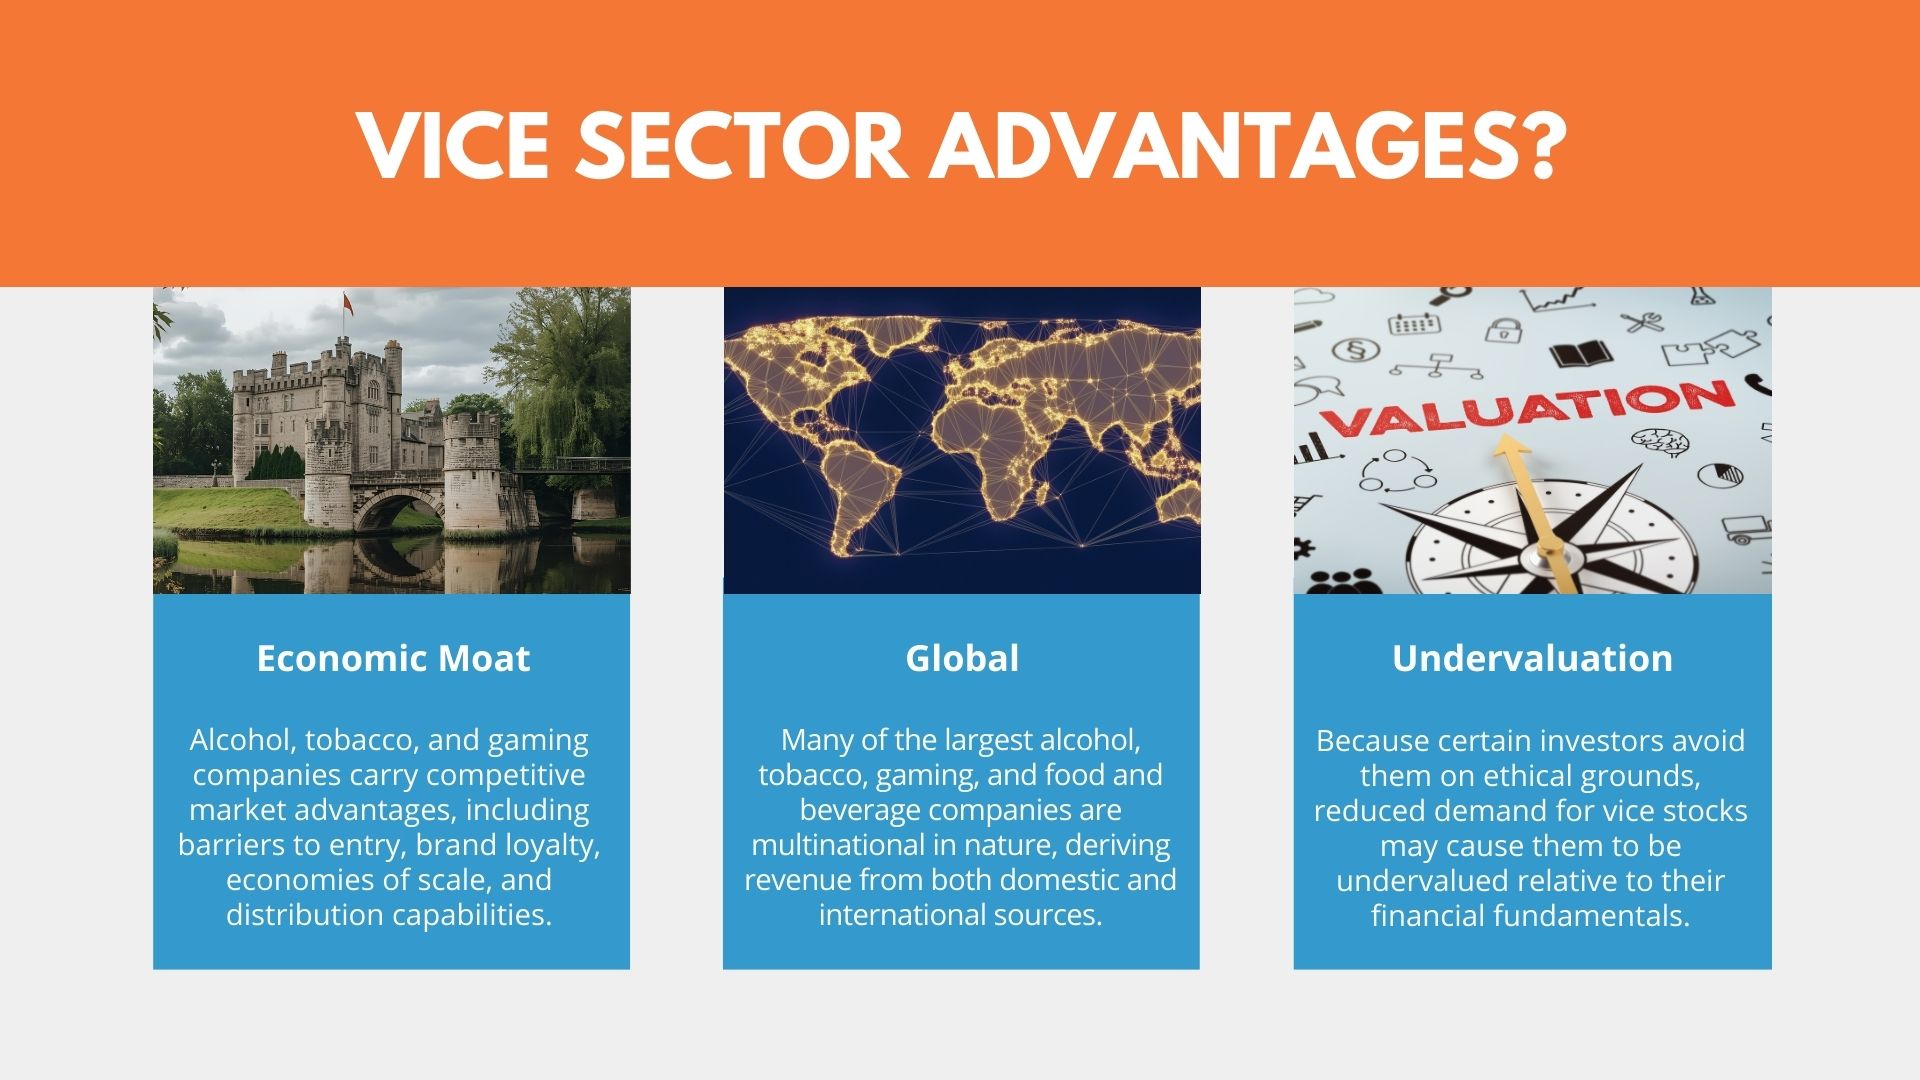
- Economic Moat Advantage– Select alcohol, tobacco, and gaming companies carry competitive market advantages including regulatory barriers, brand loyalty, economies of scale, or distribution capabilities.
- Attractive Dividends – The largest alcohol and tobacco companies have been among the equity market’s top dividend payers, exhibiting an attractive history of consistent growth and increasing dividends that can enhance the portfolio’s total return.
- Enduring Profitability – Select alcohol and tobacco companies have demonstrated attractive profit margins and free cash flow, attributable to low production costs, price inelasticity, and purchasing loyalty.
- Merger and Acquisition Potential – Companies involved in vice industries may benefit from potential merger and acquisition activity as larger companies look to enter these newer markets and expand their business.
- Global and Diversified – Many of the largest alcohol, gaming, and tobacco companies are multinational in nature, deriving revenue from both domestic and international sources. VICE also invests across multiple vice industries to add diversification to the portfolio.
About the Portfolio Manager
Dan Ahrens | Portfolio Manager
Dan Ahrens is the Managing Director, Chief Investment Officer, and Chief Operating Officer of AdvisorShares, where he oversees more than $1 billion in actively managed ETF strategies spanning equity, fixed income, and thematic investing. Over a 20-year career in portfolio management, he has built a reputation for identifying emerging industries ahead of broader market adoption — launching the Vice Fund in 2002 and later developing one of the first institutional-quality cannabis ETF suites available to U.S. investors.
He is the author of two books on thematic investing published by St. Martin’s Press and Wiley, and has appeared as a financial commentator on CNBC, Bloomberg, Fox Business, CNN, and ABC News. His work has been covered in The Economist, The Wall Street Journal, The Financial Times, and The New York Times. AdvisorShares ETFs managed by Mr. Ahrens are available on all major custodial platforms, including Schwab, Fidelity, and Pershing.


VICE Overview from Dan Ahrens
Get an introduction to the VICE ETF directly from the portfolio manager, Dan Ahrens.
VICE Overview from Dan Ahrens
Get an introduction to the VICE ETF directly from the portfolio manager, Dan Ahrens.
Fund
Price History
Fund Data
6/5/2026| NAV | $32.72 |
| Change | $0.04 |
| Shares Outstanding | 220,000 |
| Assets Under Management | $7,197,631.84 |
Market Data
6/5/2026| Closing Price | $32.64 |
| Close Change | $0.06 |
| Volume | 392 |
Regulatory Data
6/5/2026| Premium Discount | $-0.07 |
| 30-Day Median bid-ask Spread | 0.000000 |
Shares are bought and sold at market price (closing price) not NAV and are not individually redeemed from the Fund. Market price returns are based on the midpoint of the bid/ask spread at 4:00 pm Eastern Time (when NAV is normally determined), and do not represent the return you would receive if you traded at other times.
")
FUND
Characteristics
As of 5/31/2026
Source: Morningstar & AdvisorShares
FUND
Performance
As of 5/31/2026
| NAV | Market Price Return | S&P 500 | |
|---|---|---|---|
| 1 Month | -1.41 | -1.11 | 5.26 |
| 3 Months | 1.57 | 1.44 | 10.52 |
| YTD | 3.90 | 4.29 | 11.27 |
| 1 Year | 0.16 | 0.07 | 29.78 |
| 3 Years | 8.88 | 8.86 | 23.61 |
| 5 Years | -0.32 | -0.34 | 14.15 |
| Since Inception (12/12/2017, Annualized) | 4.77 | 4.76 | 14.99 |
As of 3/31/2026
| NAV | Market Price Return | S&P 500 | |
|---|---|---|---|
| 1 Month | -2.85 | -2.67 | -4.98 |
| 3 Months | -0.62 | 0.06 | -4.33 |
| YTD | -0.62 | 0.06 | -4.33 |
| 1 Year | 1.39 | 1.66 | 17.80 |
| 3 Years | 5.45 | 5.52 | 18.32 |
| 5 Years | -0.51 | -0.51 | 12.06 |
| Since Inception (12/12/2017, Annualized) | 4.31 | 4.34 | 13.24 |
Performance data quoted represents past performance and is no guarantee of future results. All Fund data and performance data quoted is believed to be accurate, and unless otherwise stated, is sourced from the Fund administrator, the Advisor’s or Sub-Advisor’s proprietary data, and Morningstar. Current performance may be lower or higher than the performance data quoted. Investment return and principal value will fluctuate so that an investor’s shares, when redeemed, may be worth more or less than original cost. Returns less than one year are not annualized.
The S&P 500 Index is a broad-based, unmanaged measurement of changes in stock market conditions based on the average of 500 widely held common stocks. One cannot invest directly in an index.
Get Social @AdvisorShares
Join the conversation on social media to hear more from the portfolio manager, get informed about upcoming events and webinars, and more!
| Date | Account Symbol | Stock Ticker | Security ID | Security Description | Shares | Share Price | Market Value | Portfolio Weight | Asset Group |
|---|---|---|---|---|---|---|---|---|---|
| 06/05/2026 | VICE | ALTO | 021513106 | ALTO INGREDIENTS INC | 110,000.00 | 5.43 | 597,300.00 | 8.30% | S |
| MCRI | 609027107 | MONARCH CASINO & RESORT INC | 3,664.00 | 122.70 | 449,572.80 | 6.25% | S | ||
| NVDA | 67066G104 | NVIDIA CORP | 1,800.00 | 205.10 | 369,180.00 | 5.13% | S | ||
| MO | 02209S103 | ALTRIA GROUP INC | 5,096.00 | 72.19 | 367,880.24 | 5.11% | S | ||
| PVH | 693656100 | PVH CORP | 4,700.00 | 77.80 | 365,660.00 | 5.08% | S | ||
| SFD | 832248207 | SMITHFIELD FOODS INC | 13,300.00 | 26.87 | 357,371.00 | 4.97% | S | ||
| CHDN | 171484108 | CHURCHILL DOWNS INC | 4,100.00 | 86.92 | 356,372.00 | 4.95% | S | ||
| ABEV | 02319V103 | AMBEV SA-ADR | 114,000.00 | 3.12 | 355,680.00 | 4.94% | FS | ||
| ACEL | 00436Q106 | ACCEL ENTERTAINMENT INC | 29,306.00 | 12.06 | 353,430.36 | 4.91% | S | ||
| GLPI | 36467J108 | GAMING AND LEISURE PROPERTIE | 7,300.00 | 47.17 | 344,341.00 | 4.78% | S | ||
| MNST | 61174X109 | MONSTER BEVERAGE CORP | 3,800.00 | 89.55 | 340,290.00 | 4.73% | S | ||
| EAT | 109641100 | BRINKER INTERNATIONAL INC | 2,400.00 | 140.46 | 337,104.00 | 4.68% | S | ||
| SBUX | 855244109 | STARBUCKS CORP | 3,500.00 | 95.29 | 333,515.00 | 4.63% | S | ||
| COCO | 92846Q107 | VITA COCO CO INC/THE | 4,500.00 | 74.09 | 333,405.00 | 4.63% | S | ||
| BTI | 110448107 | BRITISH AMERICAN TOB-SP ADR | 5,325.00 | 59.72 | 318,009.00 | 4.42% | FS | ||
| SGHC | G8588X103 | SUPER GROUP SGHC LTD | 24,500.00 | 12.94 | 317,030.00 | 4.40% | FS | ||
| NTES | 64110W102 | NETEASE INC-ADR | 2,647.00 | 119.48 | 316,263.56 | 4.39% | FS | ||
| PM | 718172109 | PHILIP MORRIS INTERNATIONAL | 1,726.00 | 178.29 | 307,728.54 | 4.28% | S | ||
| VICI | 925652109 | VICI PROPERTIES INC | 8,729.00 | 27.86 | 243,189.94 | 3.38% | S | ||
| MLCO | 585464100 | MELCO RESORTS & ENTERT-ADR | 41,433.00 | 5.70 | 236,168.10 | 3.28% | FS | ||
| GDEV | G6529J209 | GDEV INC | 13,238.00 | 12.39 | 164,018.82 | 2.28% | FS | ||
| X9USDBLYT | BLACKROCK TREASURY TRUST INSTL 62 | 78,179.73 | 1.00 | 78,179.73 | 1.09% | MM | |||
| CASH | -44,244.92 | 100.00 | -44,244.92 | -0.61% | CA |
FUND
Fees & Expenses
Annual Fund Operating Expenses (expenses that you pay each year as a percentage of the value of your investment)
| Management Fee | 0.60% | |
| Other Expenses | 1.11% | |
| Gross Expense Ratio | 1.71% | |
| Fee Waiver/Expense Reimbursement* | -0.72% | |
| Net Expense Ratio | 0.99% |
| Expense Cap Limitation* | 0.99% |
*The Advisor has contractually agreed to keep net expenses from exceeding 0.99% of the Fund’s average daily net assets for at least one year from the date of the prospectus. For more information, please read the full prospectus.
Last Ten
Fund Distributions
")

-
- Before investing you should carefully consider the Fund’s investment objectives, risks, charges and expenses. This and other information is in the prospectus, a copy of which may be obtained by visiting the Fund’s website at www.AdvisorShares.com. Please read the prospectus carefully before you invest. Foreside Fund Services, LLC, Distributor.
- The Fund is subject to a number of risks that may affect the value of its shares. This section provides additional information about the Fund’s principal risks. The degree to which a risk applies to the Fund varies according to its investment allocation. Each investor should review the complete description of the principal risks before investing in the Fund. As with investing in other securities whose prices increase and decrease in market value, you may lose money by investing in the Fund.
- Investing involves risks including possible loss of principal. Companies in the food, beverage, gambling, e-game and tobacco industry are very competitive and subject to several risks. Demographic and product trends, changing consumer preferences, nutritional and health-related concerns, competitive pricing, marketing campaigns, environmental factors, adverse changes in general economic conditions, government regulation, food inspection and processing control, consumer boycotts, risks of product tampering, product liability claims, and the availability and expense of liability insurance can affect the demand for, and success of, such companies’ products in the marketplace. For a full summary of the risks, please see the prospectus.
- Definitions
- Alpha, one of the most commonly quoted indicators of investment performance, is defined as the excess return on an investment relative to the return on a benchmark index.
ETF
Social
Conversation