
NAV as of 7/27/2026
$4.25
1 Day NAV Change as of 7/27/2026
$-0.05
| Symbol | Exchange | Inception Date | CUSIP | NAV | Options Available |
|---|---|---|---|---|---|
| MSOS | NYSE Arca | 9/1/2020 | 00768Y453 | MSOS.NV | Yes |
The Cannabis Inflection Point Is Already Here—Are You Prepared?
Hosted by AdvisorShares | July 29th, 2026 at 1:00pm ET
Why Invest in MSOS?
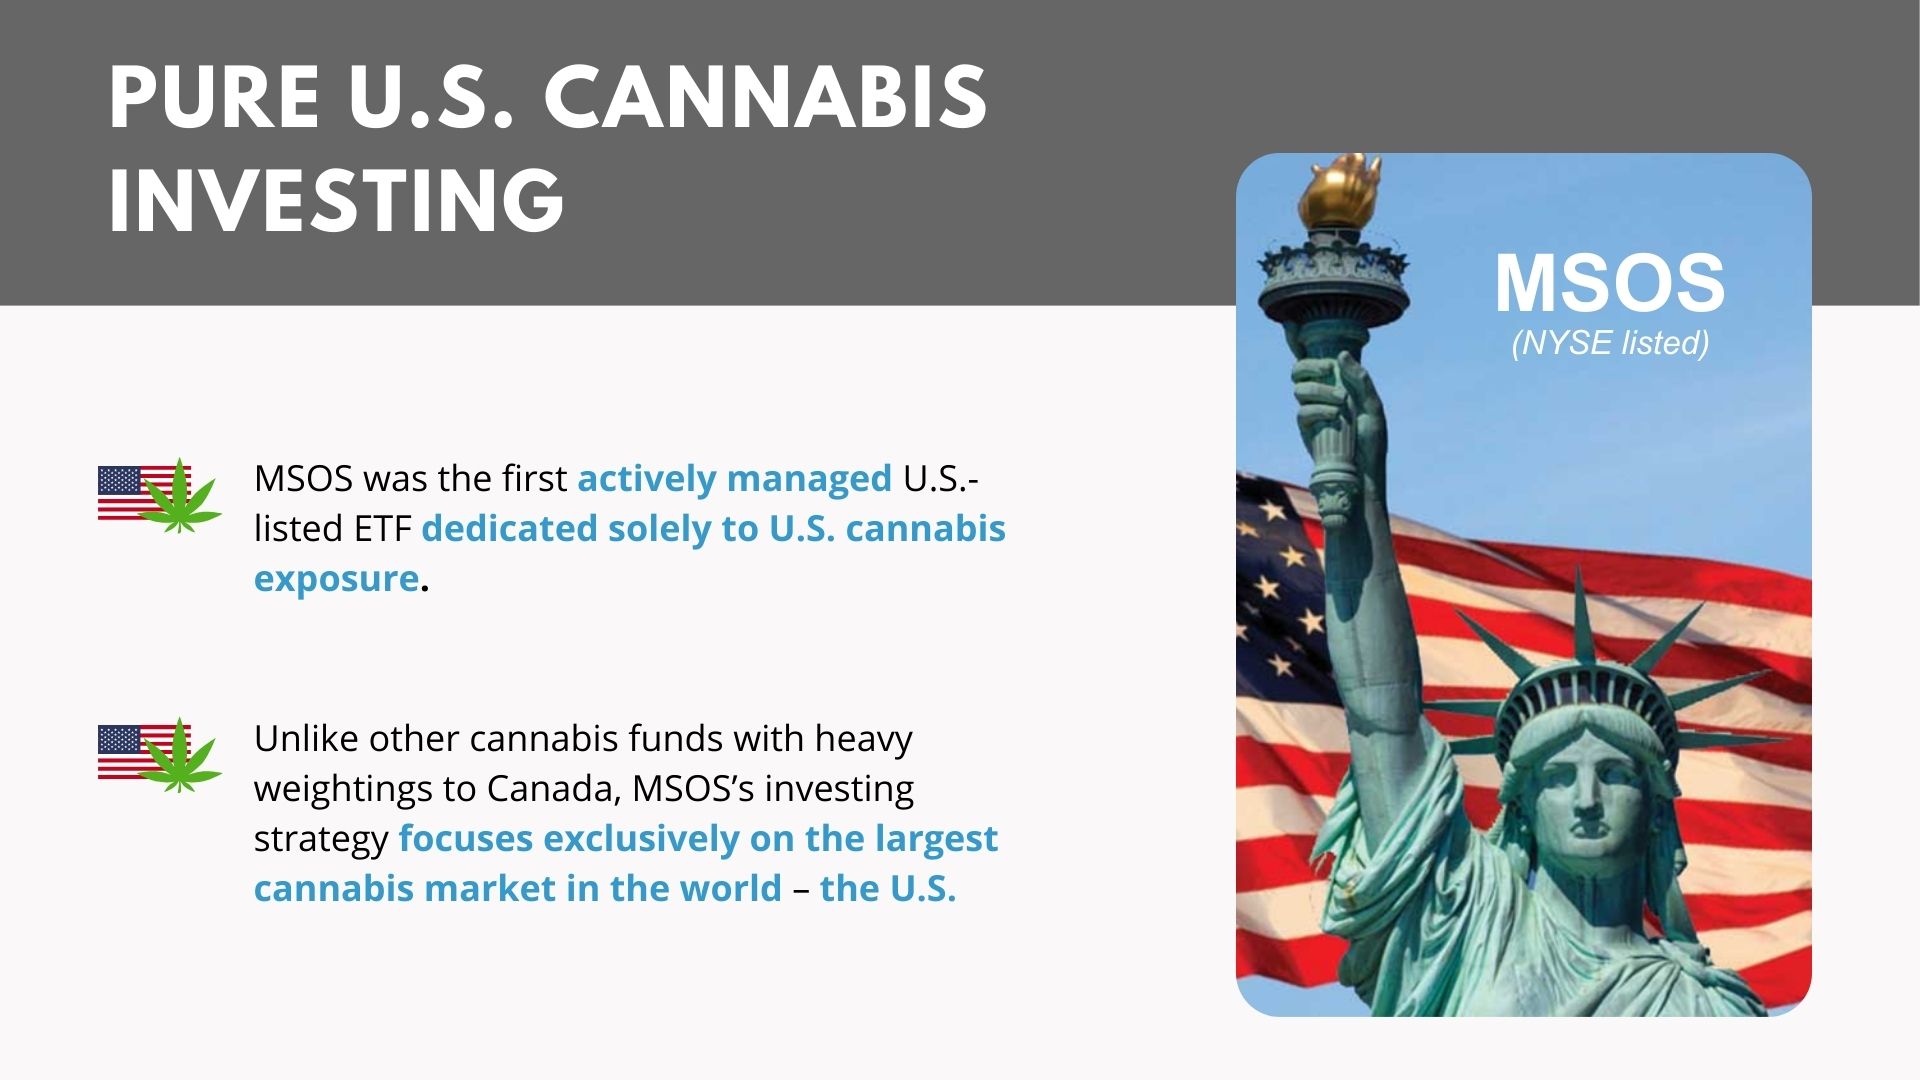
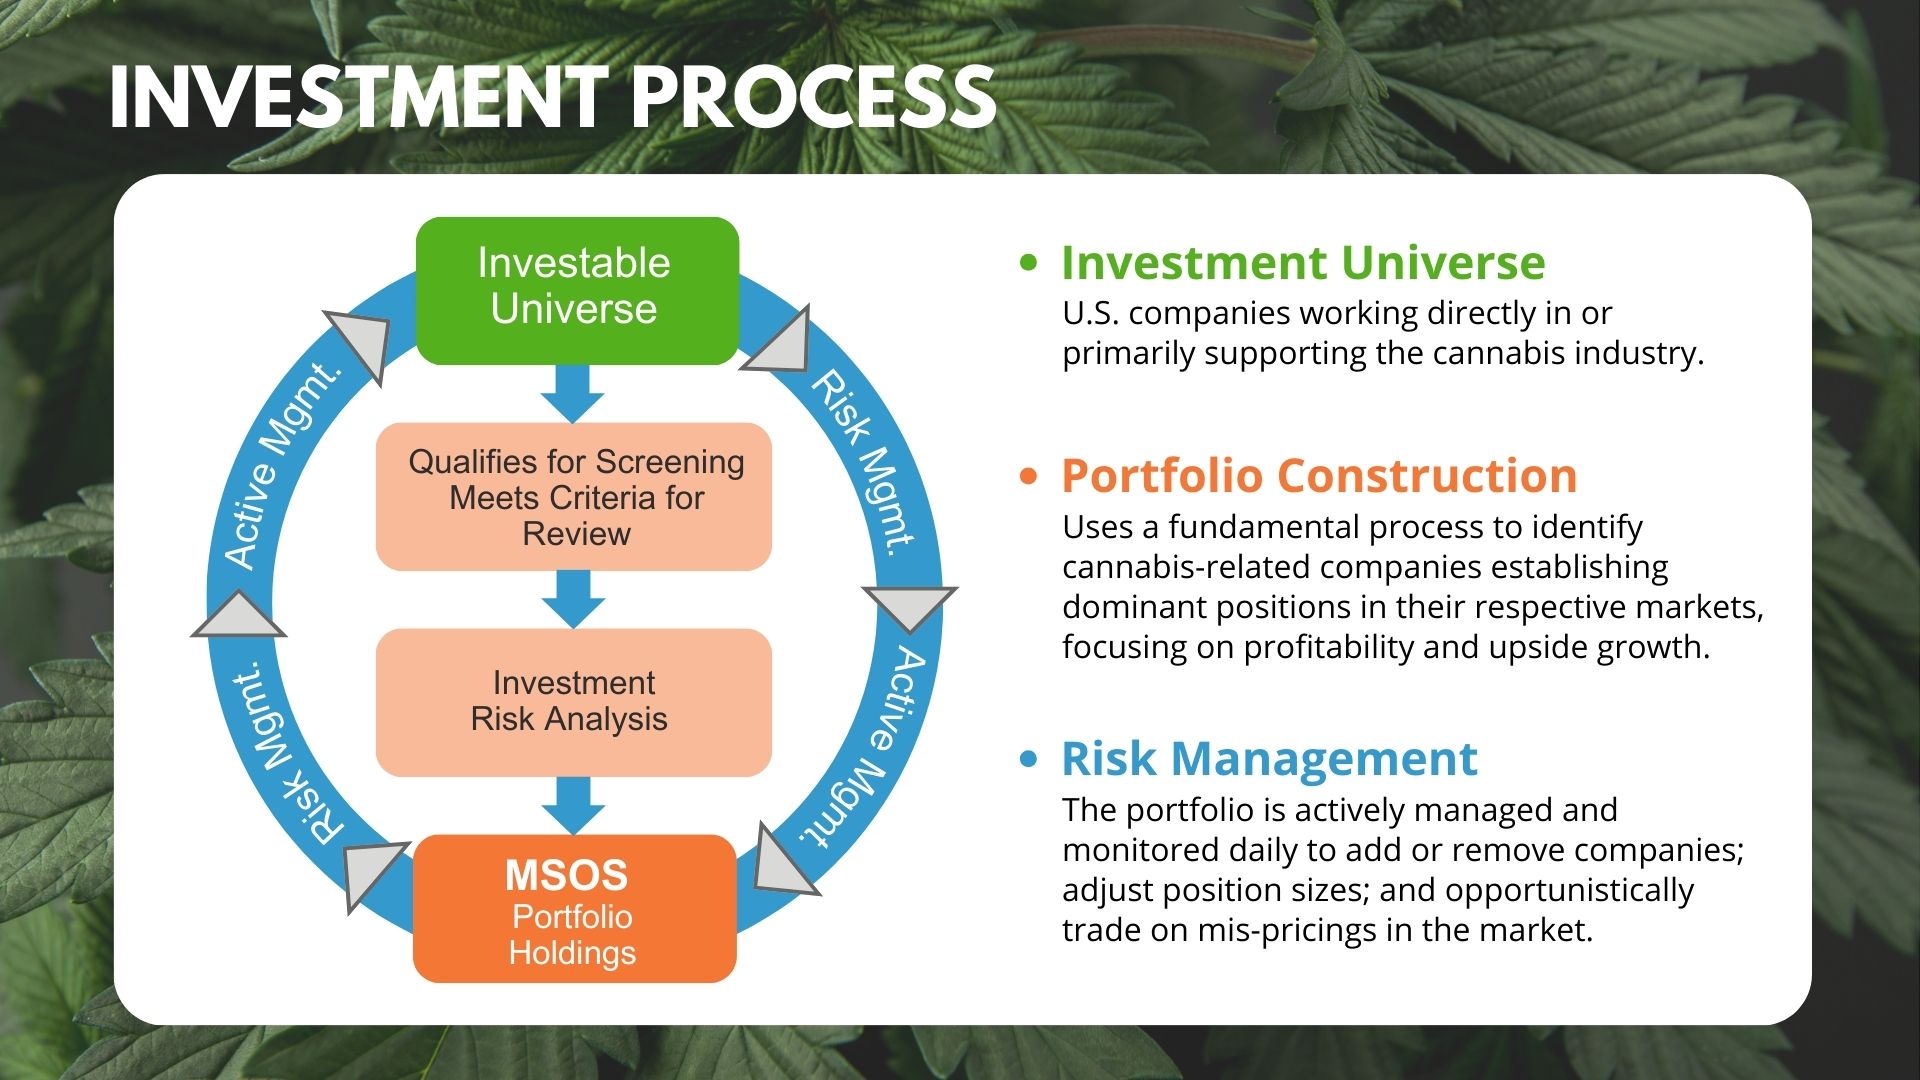
- The First U.S.-Listed ETF Available – MSOS is the first actively managed U.S.-listed ETF with dedicated cannabis exposure focusing exclusively on U.S. companies, including multi-state operators. The portfolio manager allocates across an investable universe of U.S. companies spanning a variety of cannabis-related businesses.
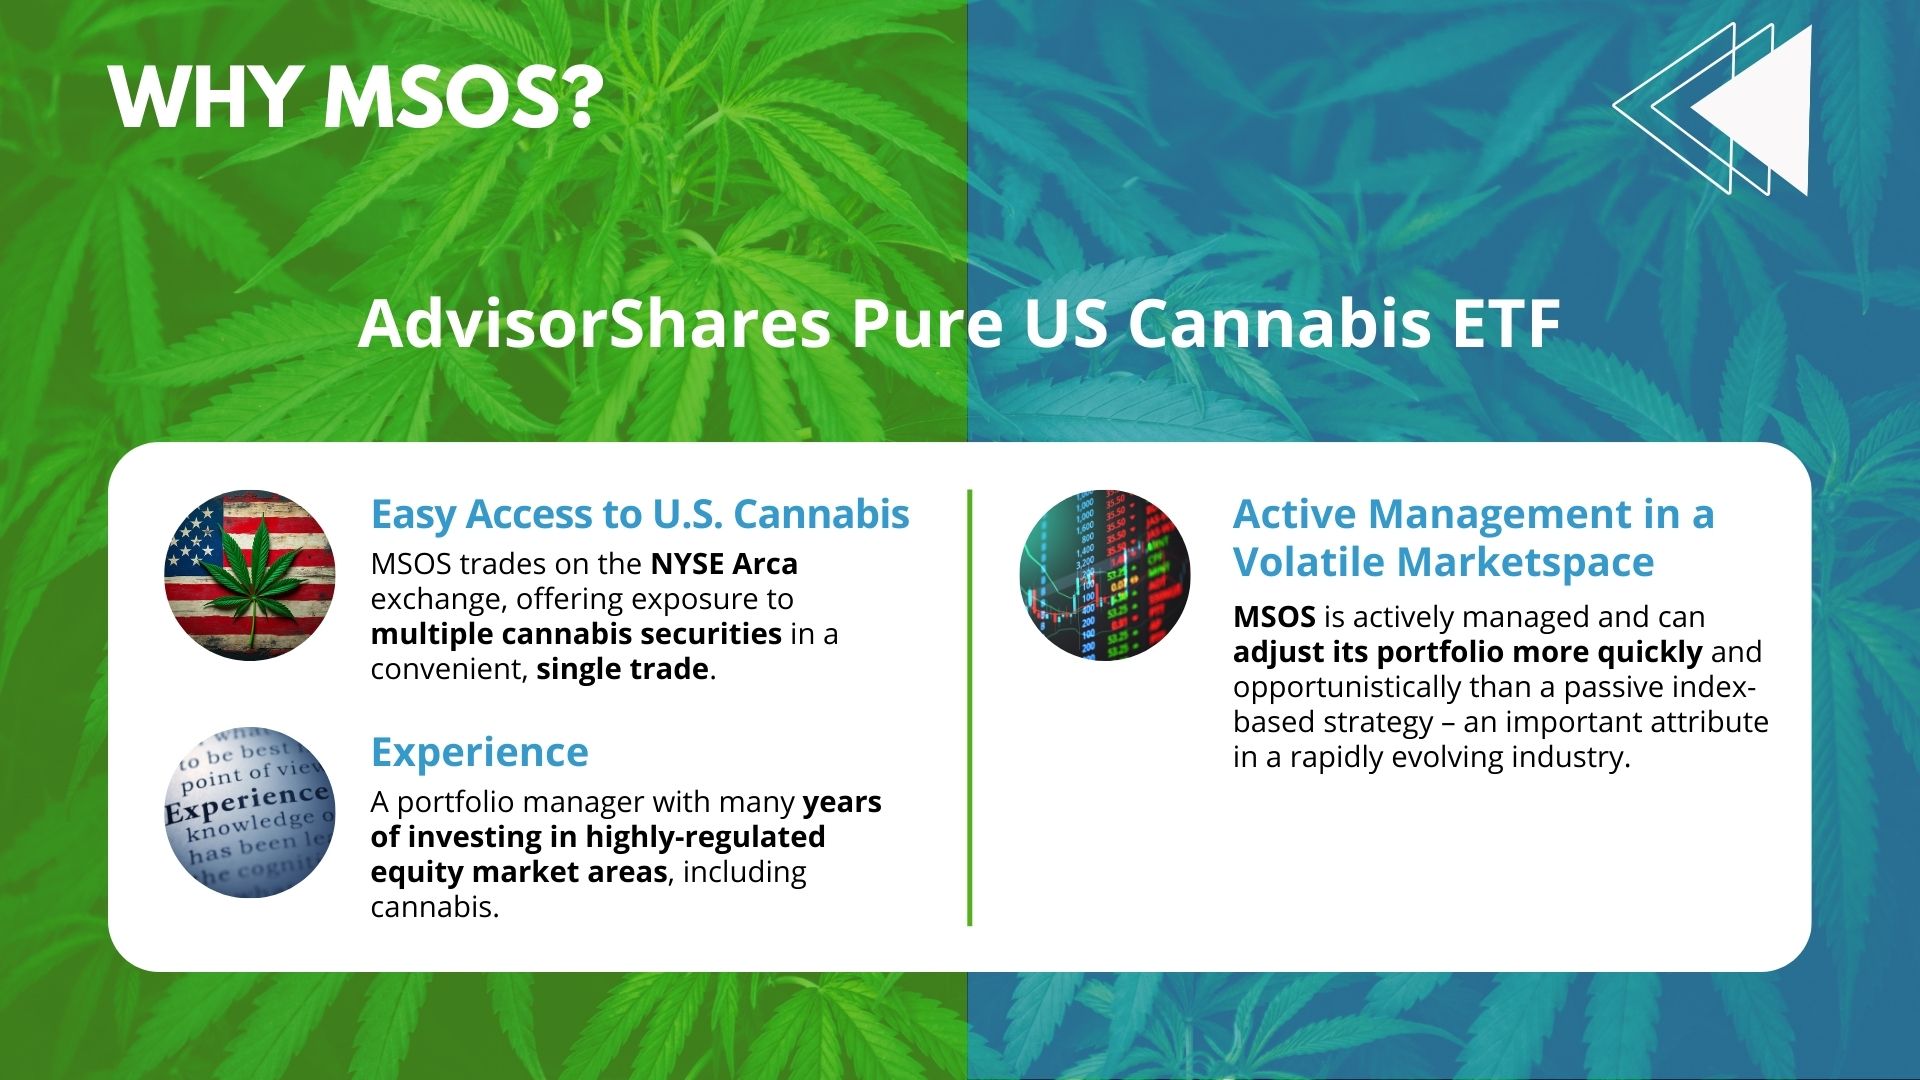
- Easy Access to U.S. Cannabis Exposure – MSOS trades on the NYSE Arca exchange, offering exposure to multiple cannabis securities in a convenient, single trade. To buy U.S. cannabis companies on your own, investors will need to seek these stocks out in smaller, foreign exchanges.
- Experience – MSOS’ portfolio manager has deep experience in the capital markets and well-established expertise investing in highly-regulated areas in the equity markets, including cannabis. MSOS assets are held by one of the largest U.S. custodial banks, BNY Mellon.
Where Can MSOS Fit in a Traditional Portfolio?
MSOS can be used as a thematic investment, offering specific and focused exposure to the U.S. cannabis market. MSOS can also deliver an alpha-seeking, high-growth complement to a broad-based equity allocation.
Key Attributes
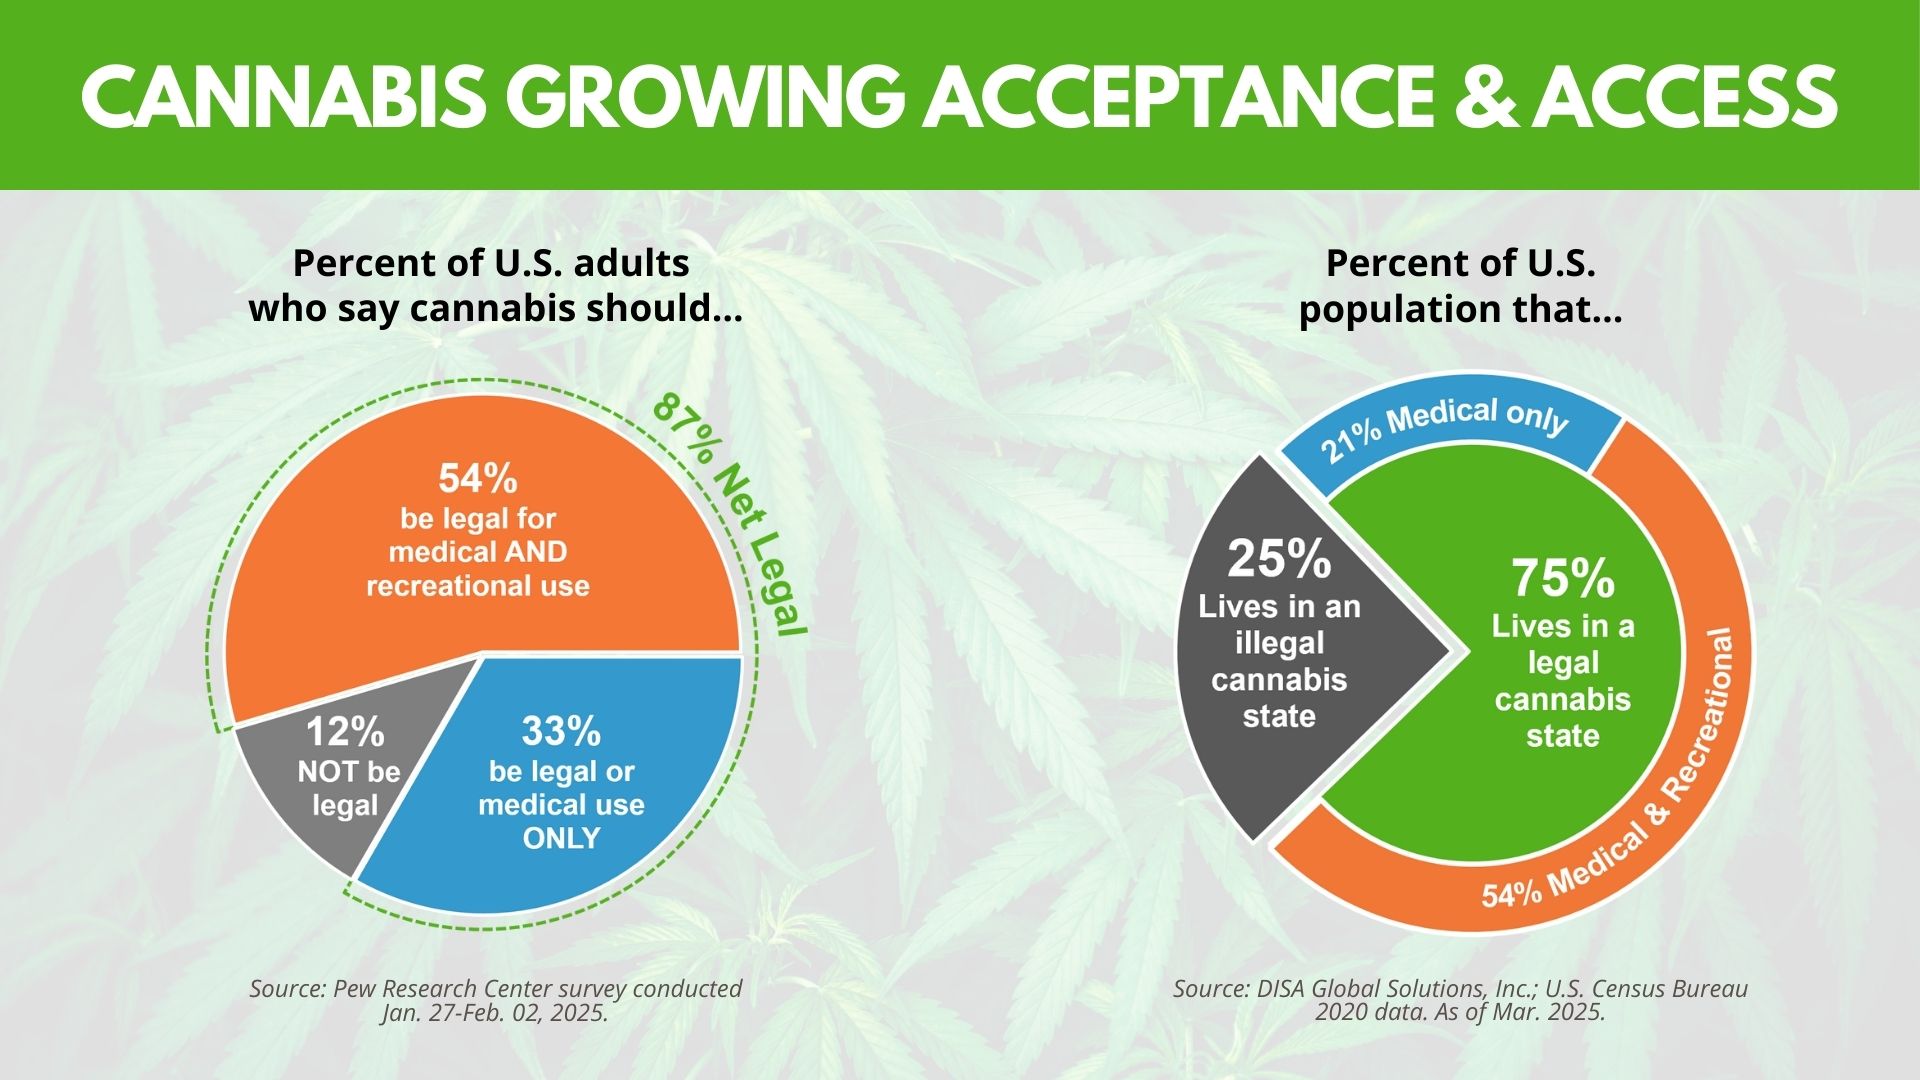
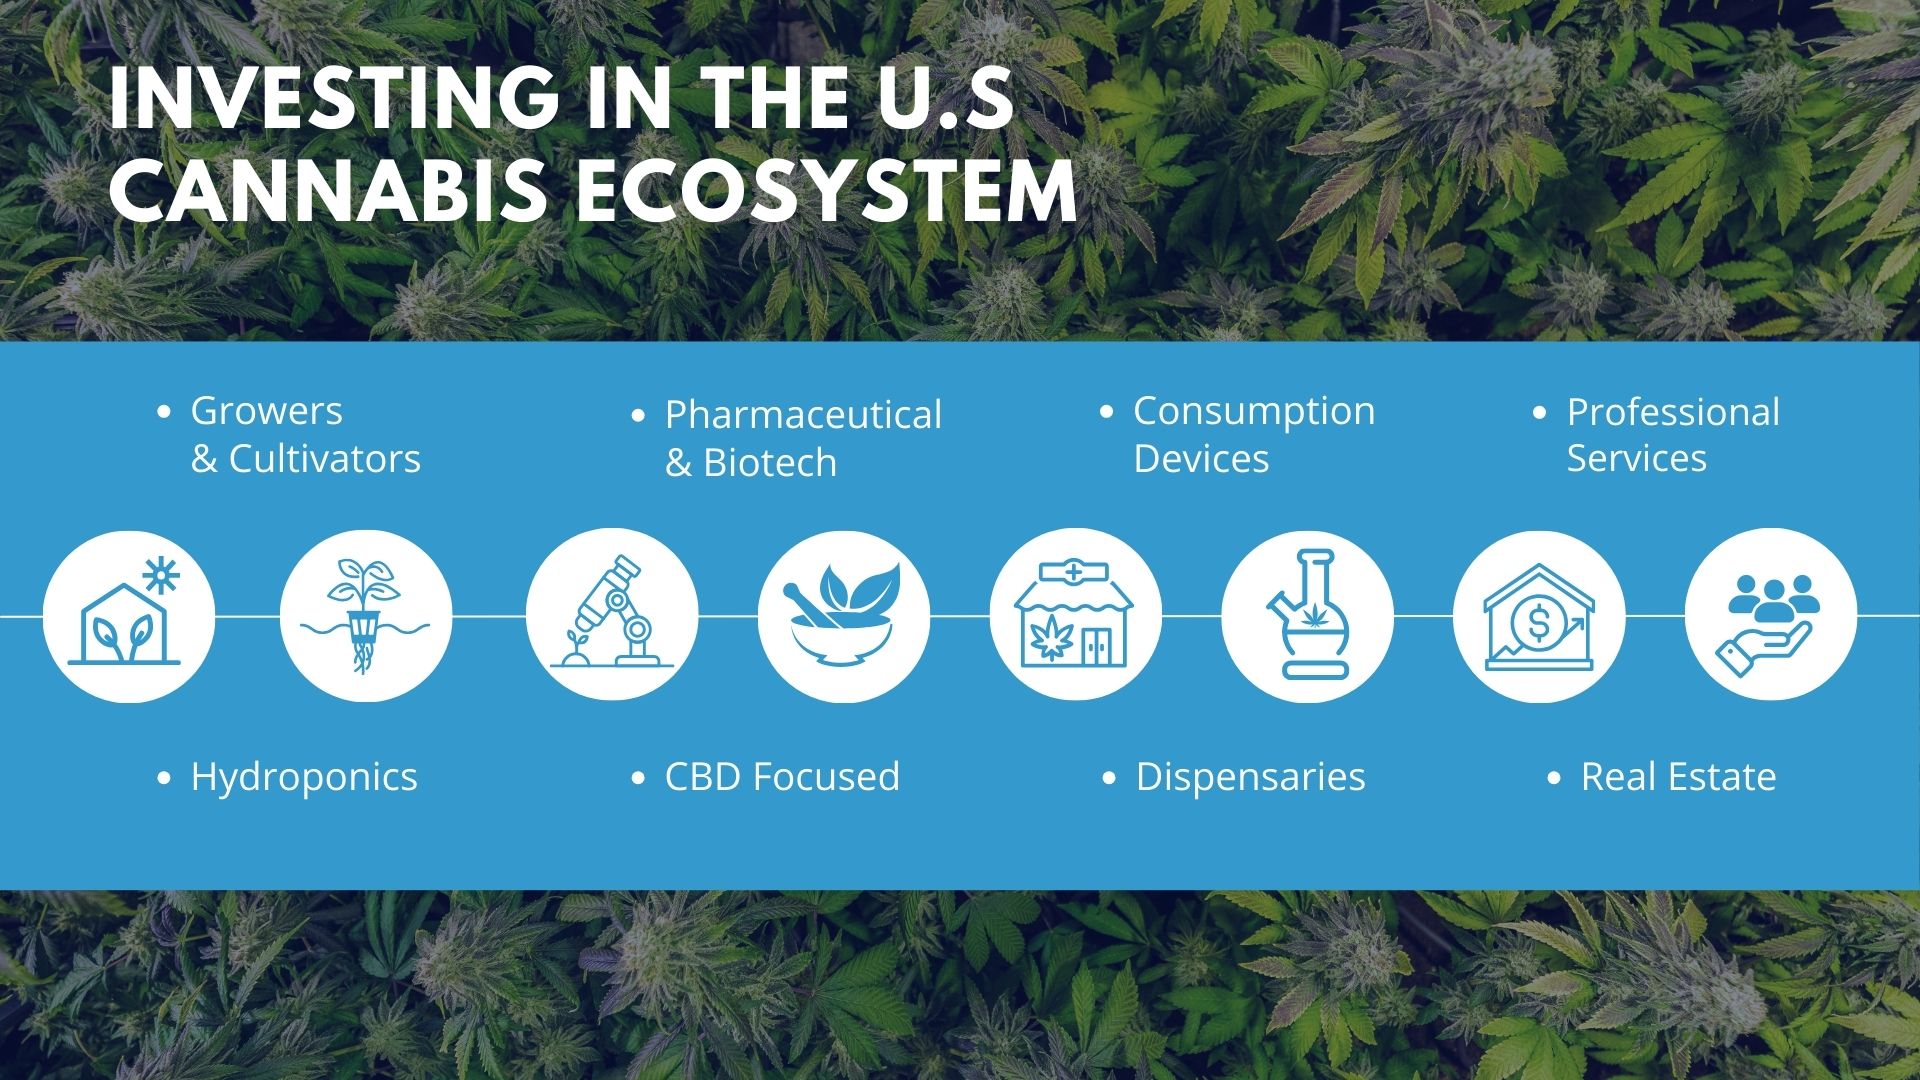
- Dedicated U.S. Cannabis Exposure – Even with limited legal availability, the U.S. cannabis market is the largest in the world and is forecast to remain so into the immediate future. The U.S. is also recognized as a leader in the cannabis space, having a reputation for creating some of the best and innovative products, as well as, mastering large scale cultivation. With exposure to U.S. companies spanning a variety of cannabis-related businesses, MSOS seeks to take advantage of this growth opportunity.
- Emerging Growth Opportunity – Cannabis securities span multiple industries including agriculture, biotechnology, pharmaceutical, real estate, retail, finance, and other medical applications. The portfolio manager believes that an evolving landscape of select, cannabis-related companies may provide upside potential that may lead to attractive growth opportunities, including the potential for merger and acquisition activity as the market matures and evolves.
- Active Management – The cannabis marketplace is quickly evolving, witnessing ongoing innovation, and seeing an influx of new companies. Additionally, cannabis-related securities can experience fluctuation and rapid change. Using daily, active management, MSOS’ portfolio manager can adjust the portfolio more quickly and opportunistically than a passive index-based strategy that must wait for periodic rebalancing.
About the Portfolio Manager
Dan Ahrens | Portfolio Manager
Dan Ahrens is the Managing Director, Chief Investment Officer, and Chief Operating Officer of AdvisorShares, where he oversees more than $1 billion in actively managed ETF strategies spanning equity, fixed income, and thematic investing. Over a 20-year career in portfolio management, he has built a reputation for identifying emerging industries ahead of broader market adoption — launching the Vice Fund in 2002 and later developing one of the first institutional-quality cannabis ETF suites available to U.S. investors.
He is the author of two books on thematic investing published by St. Martin’s Press and Wiley, and has appeared as a financial commentator on CNBC, Bloomberg, Fox Business, CNN, and ABC News. His work has been covered in The Economist, The Wall Street Journal, The Financial Times, and The New York Times. AdvisorShares ETFs managed by Mr. Ahrens are available on all major custodial platforms, including Schwab, Fidelity, and Pershing.


MSOS Overview from Dan Ahrens
Get an introduction to the MSOS ETF directly from the portfolio manager, Dan Ahrens.
MSOS Overview from Dan Ahrens
Get an introduction to the MSOS ETF directly from the portfolio manager, Dan Ahrens.
Fund
Price History
Fund Data
7/27/2026| NAV | $4.25 |
| Change | $-0.05 |
| Shares Outstanding | 202,880,000 |
| Assets Under Management | $862,709,052.70 |
Market Data
7/27/2026| Closing Price | $4.24 |
| Close Change | $-0.02 |
| Volume | 2,339,061 |
Regulatory Data
7/27/2026| Premium Discount | $-0.02 |
| 30-Day Median bid-ask Spread | 0.220022 |
Shares are bought and sold at market price (closing price) not NAV and are not individually redeemed from the Fund. Market price returns are based on the midpoint of the bid/ask spread at 4:00 pm Eastern Time (when NAV is normally determined), and do not represent the return you would receive if you traded at other times.
")
FUND
Characteristics
As of 6/30/2026

Source: Morningstar & AdvisorShares *Fund Characteristic Do Not Include Cash
FUND
Performance
As of 6/30/2026
| NAV | Market Price Return | North American Marijuana Index | S&P 500 Index | |
|---|---|---|---|---|
| 1 Month | 2.69 | 2.63 | -2.86 | -0.95 |
| 3 Months | 42.15 | 42.82 | 1.82 | 15.20 |
| YTD | 8.69 | 7.87 | -6.57 | 10.21 |
| 1 Year | 113.68 | 111.25 | 35.90 | 22.32 |
| 3 Year | -2.61 | -2.97 | -2.21 | 20.61 |
| 5 Year | -33.82 | -33.83 | -30.39 | 13.41 |
| Since Inception (9/1/2020, Annualized) | -23.86 | -23.92 | -20.30 | 15.49 |
As of 6/30/2026
| NAV | Market Price Return | North American Marijuana Index | S&P 500 Index | |
|---|---|---|---|---|
| 1 Month | 2.69 | 2.63 | -3.43 | -0.95 |
| 3 Months | 42.15 | 42.82 | -20.54 | 15.20 |
| YTD | 8.69 | 7.87 | -2.59 | 10.21 |
| 1 Year | 113.68 | 111.25 | -2.59 | 22.32 |
| 3 Year | -2.61 | -2.97 | -10.62 | 20.61 |
| 5 Year | -33.82 | -33.83 | -26.37 | 13.41 |
| Since Inception (9/1/2020, Annualized) | -23.86 | -23.92 | -20.96 | 15.49 |
Performance data quoted represents past performance and is no guarantee of future results. All Fund data and performance data quoted is believed to be accurate, and unless otherwise stated, is sourced from the Fund administrator, the Advisor’s or Sub-Advisor’s proprietary data, and Morningstar. Current performance may be lower or higher than the performance data quoted. Investment return and principal value will fluctuate so that an investor’s shares, when redeemed, may be worth more or less than original cost. Returns less than one year are not annualized.
The S&P 500 Index is a broad-based, unmanaged measurement of changes in stock market conditions based on the average of 500 widely held common stocks. One cannot invest directly in an index.
The North American Cannabis Index tracks the performance of a basket of North American publicly listed companies with significant business activities in the marijuana industry.
Get Social @AdvisorShares
Join the conversation on social media to hear more from the portfolio manager, get informed about upcoming events and webinars, and more!
Fund
| Date | Account Symbol | Stock Ticker | Security ID | Security Description | Shares | Share Price | Market Value | Portfolio Weight | Asset Group |
|---|---|---|---|---|---|---|---|---|---|
| 07/27/2026 | MSOS | CURLF | 23126M300 | CURALEAF HOLDINGS INC | 27,356,838.67 | 8.91 | 243,626,326.75 | 28.24% | FS |
| TRLV | 89788C104 | TRULIEVE CANNABIS CORP | 27,315,827.00 | 8.33 | 227,540,838.91 | 26.37% | FS | ||
| GTBIF | GTBIFNOM | GREEN THUMB INDUSTRIES SWAP | 24,243,586.00 | 7.11 | 172,371,896.46 | 19.98% | TW | ||
| GLAS | 377130406 | GLASS HOUSE BRANDS INC | 7,430,039.00 | 10.12 | 75,191,994.68 | 8.72% | FS | ||
| VRNO | VRNONOM | VERANO HOLDINGS CORP SWAP | 9,563,864.20 | 5.39 | 51,549,228.04 | 5.98% | TW | ||
| CRLBF | CRLBFNOM | CRESCO LABS INC-SUBORDIN | 53,741,776.00 | 0.67 | 35,899,506.37 | 4.16% | TW | ||
| TSNDF | 88105E108 | TERRASCEND CORP | 63,508,695.00 | 0.53 | 33,342,064.88 | 3.86% | FS | ||
| JUSHF | JUSHFNOM | JUSHI HOLDINGS INC SWAP | 35,202,369.00 | 0.41 | 14,478,734.37 | 1.68% | TW | ||
| CXXIF | CXXIFNOM | C21 INVESTMENTS INC | 18,141,857.00 | 0.21 | 3,840,631.13 | 0.45% | TW | ||
| VREOF | VREOFNOM | VIREO GROWTH INC COM SWAP | 339,385.77 | 9.70 | 3,292,041.94 | 0.38% | TW | ||
| VFF | 92707Y108 | VILLAGE FARMS INTERNATIONAL | 1,602,027.00 | 2.03 | 3,252,114.81 | 0.38% | FS | ||
| PLNH | PLNHNOM | PLANET 13 HOLDINGS INC | 22,883,488.00 | 0.12 | 2,746,018.56 | 0.32% | TW | ||
| AAWH | AAWHNOM | ASCEND WELLNESS HOLDINGS SWAP REC | 6,870,972.00 | 0.39 | 2,679,679.08 | 0.31% | TW | ||
| GRUSF | GRUSFNOM | GROWN ROGUE INTERNATIONAL SWAP | 4,317,564.00 | 0.39 | 1,683,849.96 | 0.20% | TW | ||
| VEXTF | VEXTFNOM | VAPEN MJ VENTURES CORP SWAP | 5,136,256.00 | 0.17 | 889,856.35 | 0.10% | TW | ||
| MRMD | MRMDNOM | MARIMED INC SWAP | 7,075,980.00 | 0.07 | 479,043.85 | 0.06% | TW | ||
| CNTMF | 34380L102 | FLUENT CORP | 5,163,788.00 | 0.02 | 118,767.12 | 0.01% | FS | ||
| CBSTF | CBSTFNOM | CANNABIST COMPANY HOLDINGS INC SWAP | 30,240,116.00 | 0.00 | 3,024.01 | 0.00% | TW | ||
| CBDHF | 423821107 | HEMPFUSION WELLNESS INC | 2,388,103.00 | 0.00 | - | 0.00% | FS | ||
| BNYMCRNOM | BNYMCRNOM | DERIVATIVES COLLATERAL NOMURA | 290,271,819.04 | 1.00 | 290,271,819.04 | 33.65% | MM | ||
| BNYMCRNBC | BNYMCRNBC | DERIVATIVES COLLATERAL NBC | 135,043,706.56 | 1.00 | 135,043,706.56 | 15.65% | MM | ||
| BNYMCRMAR | BNYMCRMAR | DERIVATIVES COLLATERAL MAREX | 79,952,043.24 | 1.00 | 79,952,043.24 | 9.27% | MM | ||
| BNYMCRCAN | BNYMCRCAN | DERIVATIVES COLLATERAL CF SECURED | 59,779,837.77 | 1.00 | 59,779,837.77 | 6.93% | MM | ||
| X9USDBLYT | X9USDBLYT | BLACKROCK TREASURY TRUST INSTL 62 | 27,461,140.88 | 1.00 | 27,461,140.88 | 3.18% | MM | ||
| BNYMCRCLR | BNYMCRCLR | DERIVATIVES COLLATERAL CLEARSTREET | 13,599,696.31 | 1.00 | 13,599,696.31 | 1.58% | MM | ||
| CASH | (616,356,717.68) | 100.00 | (616,356,717.68) | -71.44% | CA |
Download the full MSOS holdings file to view swap vs. direct stock exposure by position >>
FUND
Documents
FUND
Fees & Expenses
Annual Fund Operating Expenses (expenses that you pay each year as a percentage of the value of your investment)
| Management Fee | 0.60% | |
| Other Expenses | 0.16% | |
| Acquired Fund Fees and Expenses* | 0.03% | |
| Recaptured Fees/Expenses* | 0.02% | |
| Gross Expense Ratio | 0.81% | |
| Fee Waiver/Expense Reimbursement* | -0.03% | |
| Net Expense Ratio | 0.78% |
| Expense Cap Limitation* | 0.74% |
*Total Annual Operating Expenses and Total Annual Operating Expenses After Waiver/Reimbursement in this fee table may not correlate to the expense ratios in the Fund’s financial highlights. The Advisor has contractually agreed to keep net expenses from exceeding 0.74% of the Fund’s average daily net assets for at least one year from the date of the prospectus. Acquired fund fees represent the indirect costs a fund bears when it invests in other funds like mutual funds or ETFs. Listed separately in a fund’s prospectus for clarity, especially in fund-of-funds structures, these fees aren’t paid directly by investors but are factored into the total expense ratio and can influence performance. The table above shows that the Advisor recaptured 0.02% during the most recent fiscal year, which is an expense of the Fund. For more information, please read the full prospectus.
Last Ten
Fund Distributions
 Cannabis Without Borders
- Before investing you should carefully consider the Fund’s investment objectives, risks, charges and expenses. This and other information is in the prospectus, a copy of which may be obtained by visiting the Fund’s website at www.AdvisorShares.com. Please read the prospectus carefully before you invest. Foreside Fund Services, LLC, Distributor.
- The Fund is subject to a number of risks that may affect the value of its shares. This section provides additional information about the Fund’s principal risks. The degree to which a risk applies to the Fund varies according to its investment allocation. Each investor should review the complete description of the principal risks before investing in the Fund. As with investing in other securities whose prices increase and decrease in market value, you may lose money by investing in the Fund.
- Cannabis-Related Company Risk – Cannabis-related companies are subject to various laws and regulations that may differ at the state/local and federal level. These laws and regulations may (i) significantly affect a cannabis-related company’s ability to secure financing, (ii) impact the market for marijuana industry sales and services, and (iii) set limitations on marijuana use, production, transportation, and storage. Cannabis-related companies may also be required to secure permits and authorizations from government agencies to cultivate or research marijuana. In addition, cannabis-related companies are subject to the risks associated with the greater agricultural industry, including changes to or trends that affect commodity prices, labor costs, weather conditions, and laws and regulations related to environmental protection, health and safety. Cannabis-related companies may also be subject to risks associated with the biotechnology and pharmaceutical industries. These risks include increased government regulation, the use and enforcement of intellectual property rights and patents, technological change and obsolescence, product liability lawsuits, and the risk that research and development may not necessarily lead to commercially successful products. Shares are bought and sold at market price not net asset value (NAV) and are not individually redeemed from the Fund. Market price returns are based on the midpoint of the bid/ask spread at 4:00 pm Eastern Time (when NAV is normally determined) and do not represent the return you would receive if you traded at other times.
- Definitions
- Alpha, one of the most commonly quoted indicators of investment performance, is defined as the excess return on an investment relative to the return on a benchmark index.
ETF
Social
Conversation