
| Symbol | Exchange | Inception Date | CUSIP | NAV | Options Available |
|---|---|---|---|---|---|
| DWSH | Nasdaq | 7/10/2018 | 00768Y529 | DWSH.NV | Yes |
About The ETF
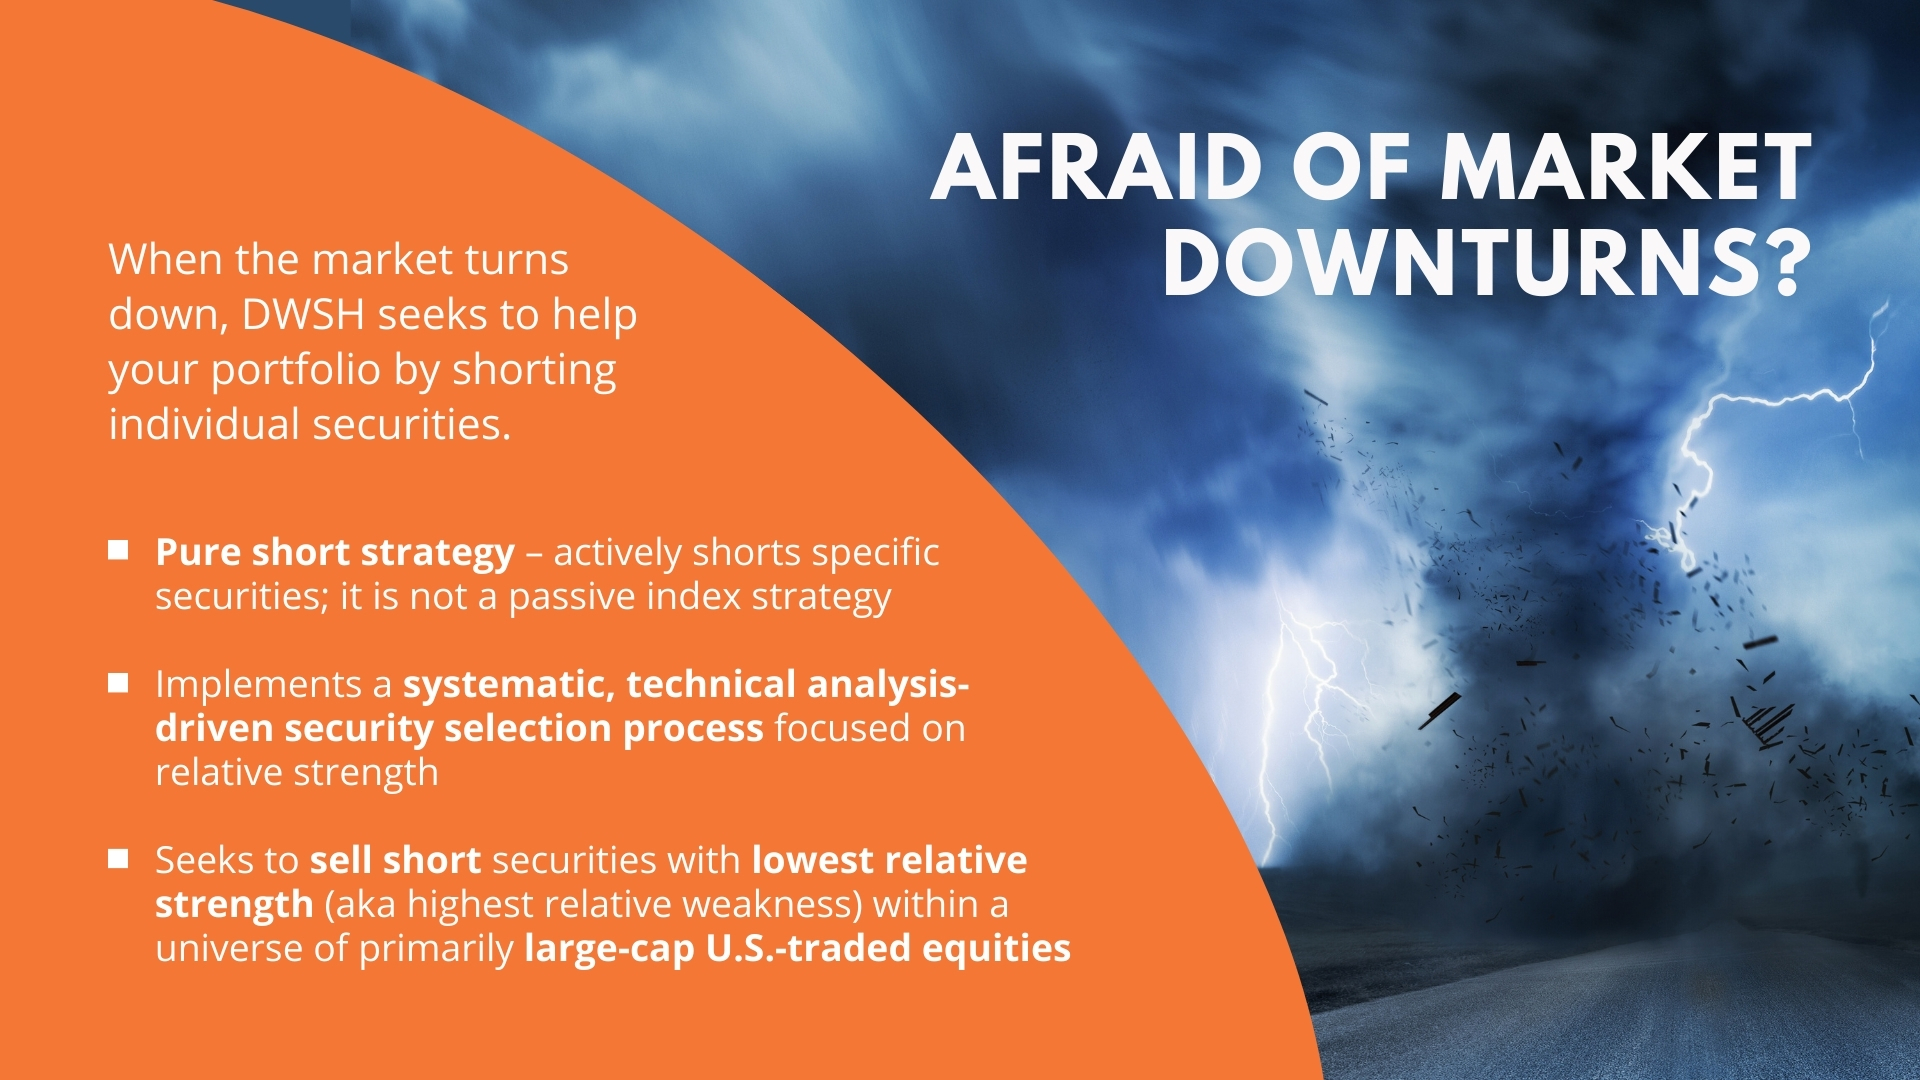
While people often insure their most valuable possessions – cars, homes, jewelry, health, life – from loss or damage, they often overlook sheltering their investment portfolio from the harm of volatile markets. Using a short hedging strategy with a long equity portfolio may help to shield your financial investments from unexpected market downturns.
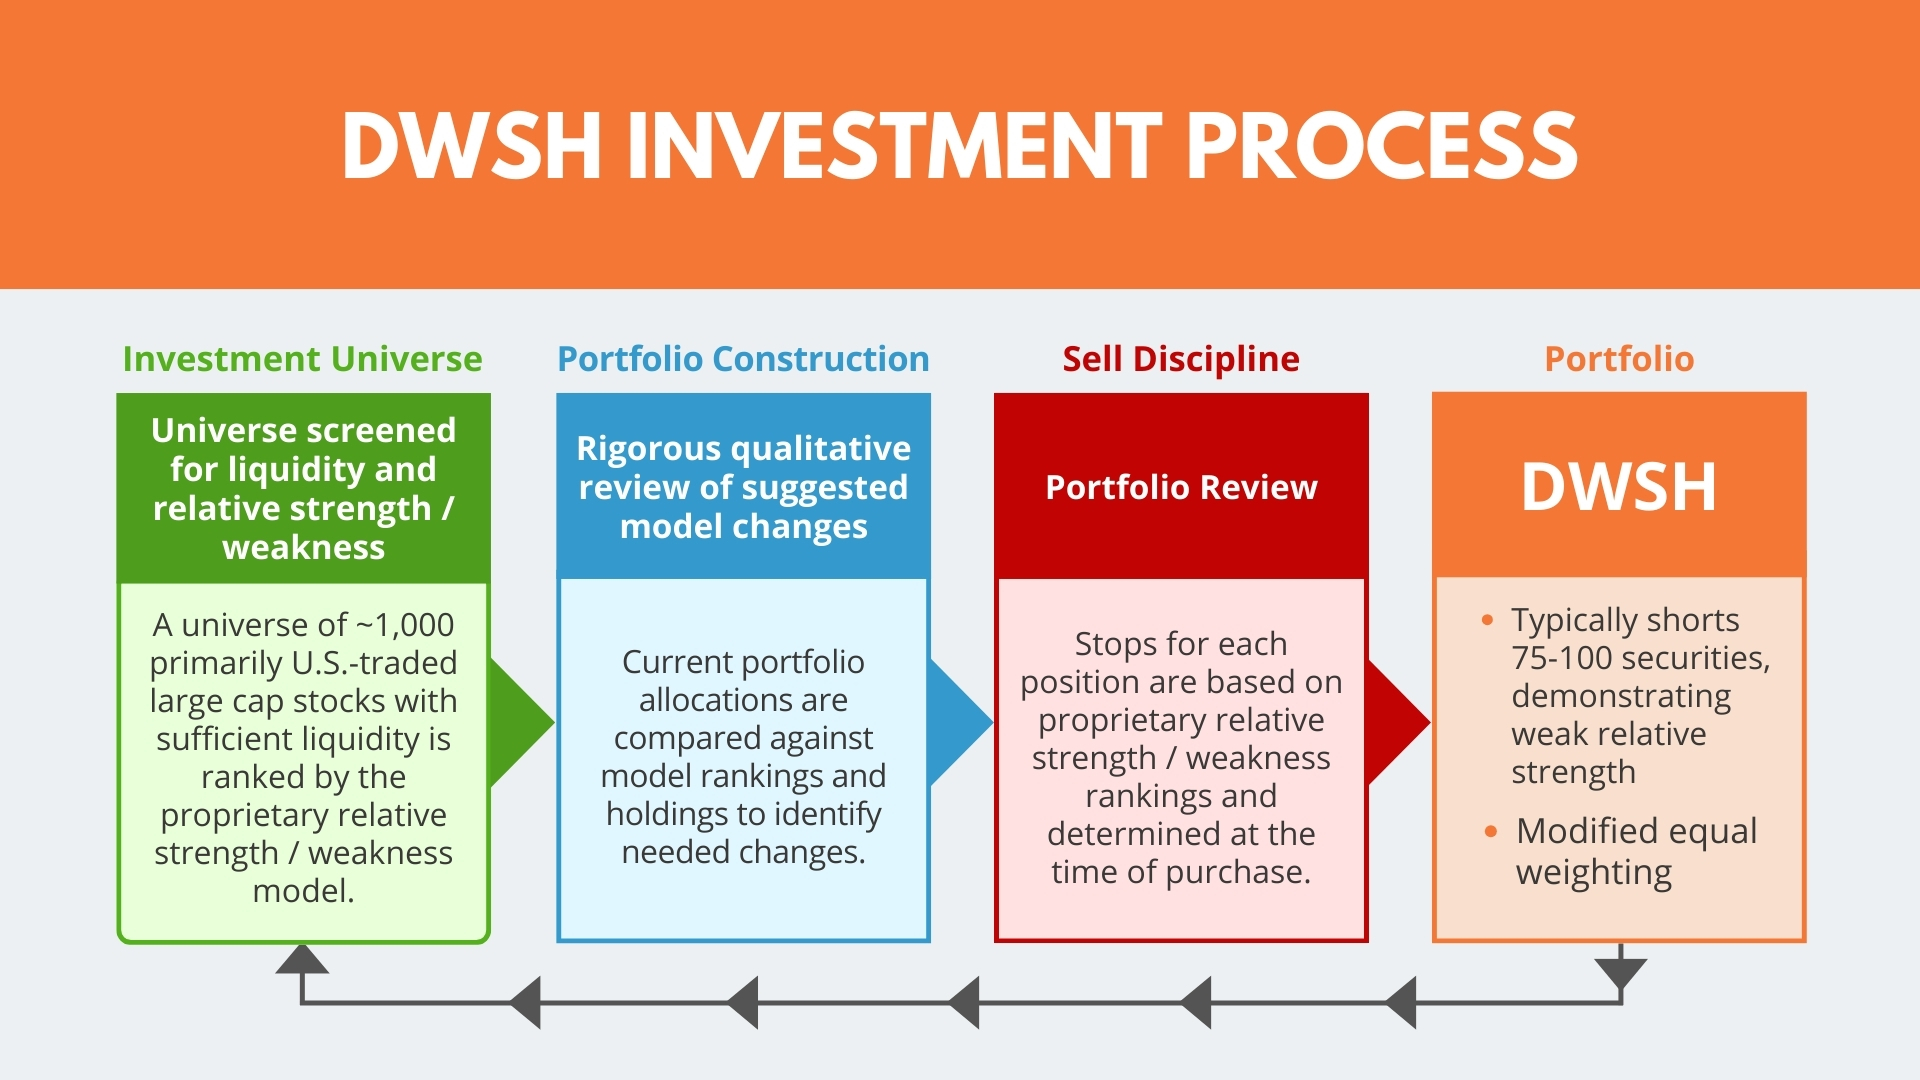
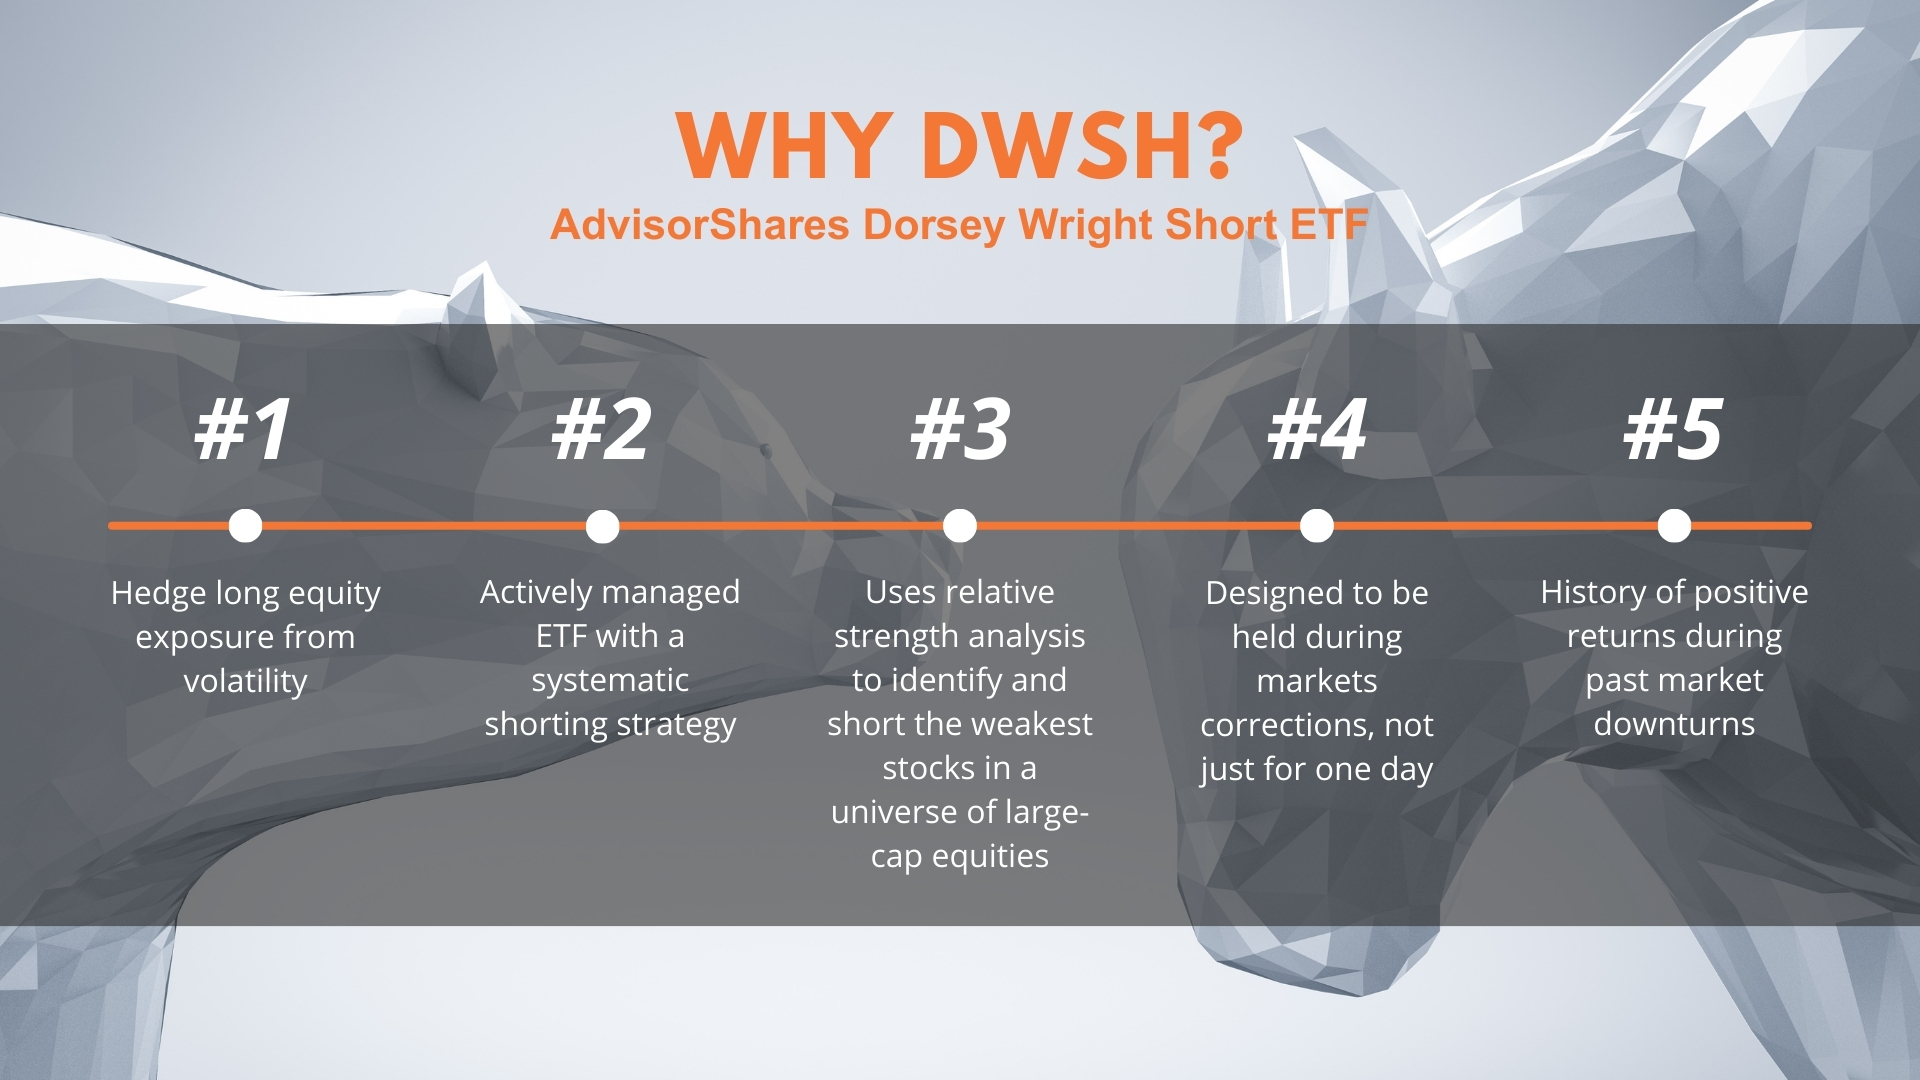
The AdvisorShares Dorsey Wright Short ETF (DWSH) uses an actively managed, relative strength investment strategy to sell short those securities demonstrating the lowest relative strength (aka highest relative weakness) within an investment universe comprised primarily of large-capitalization U.S.-traded equities. DWSH may be used to hedge long equity exposure and seek positive returns in declining equity markets. It is not an inverse fund.
What Is Relative Strength?
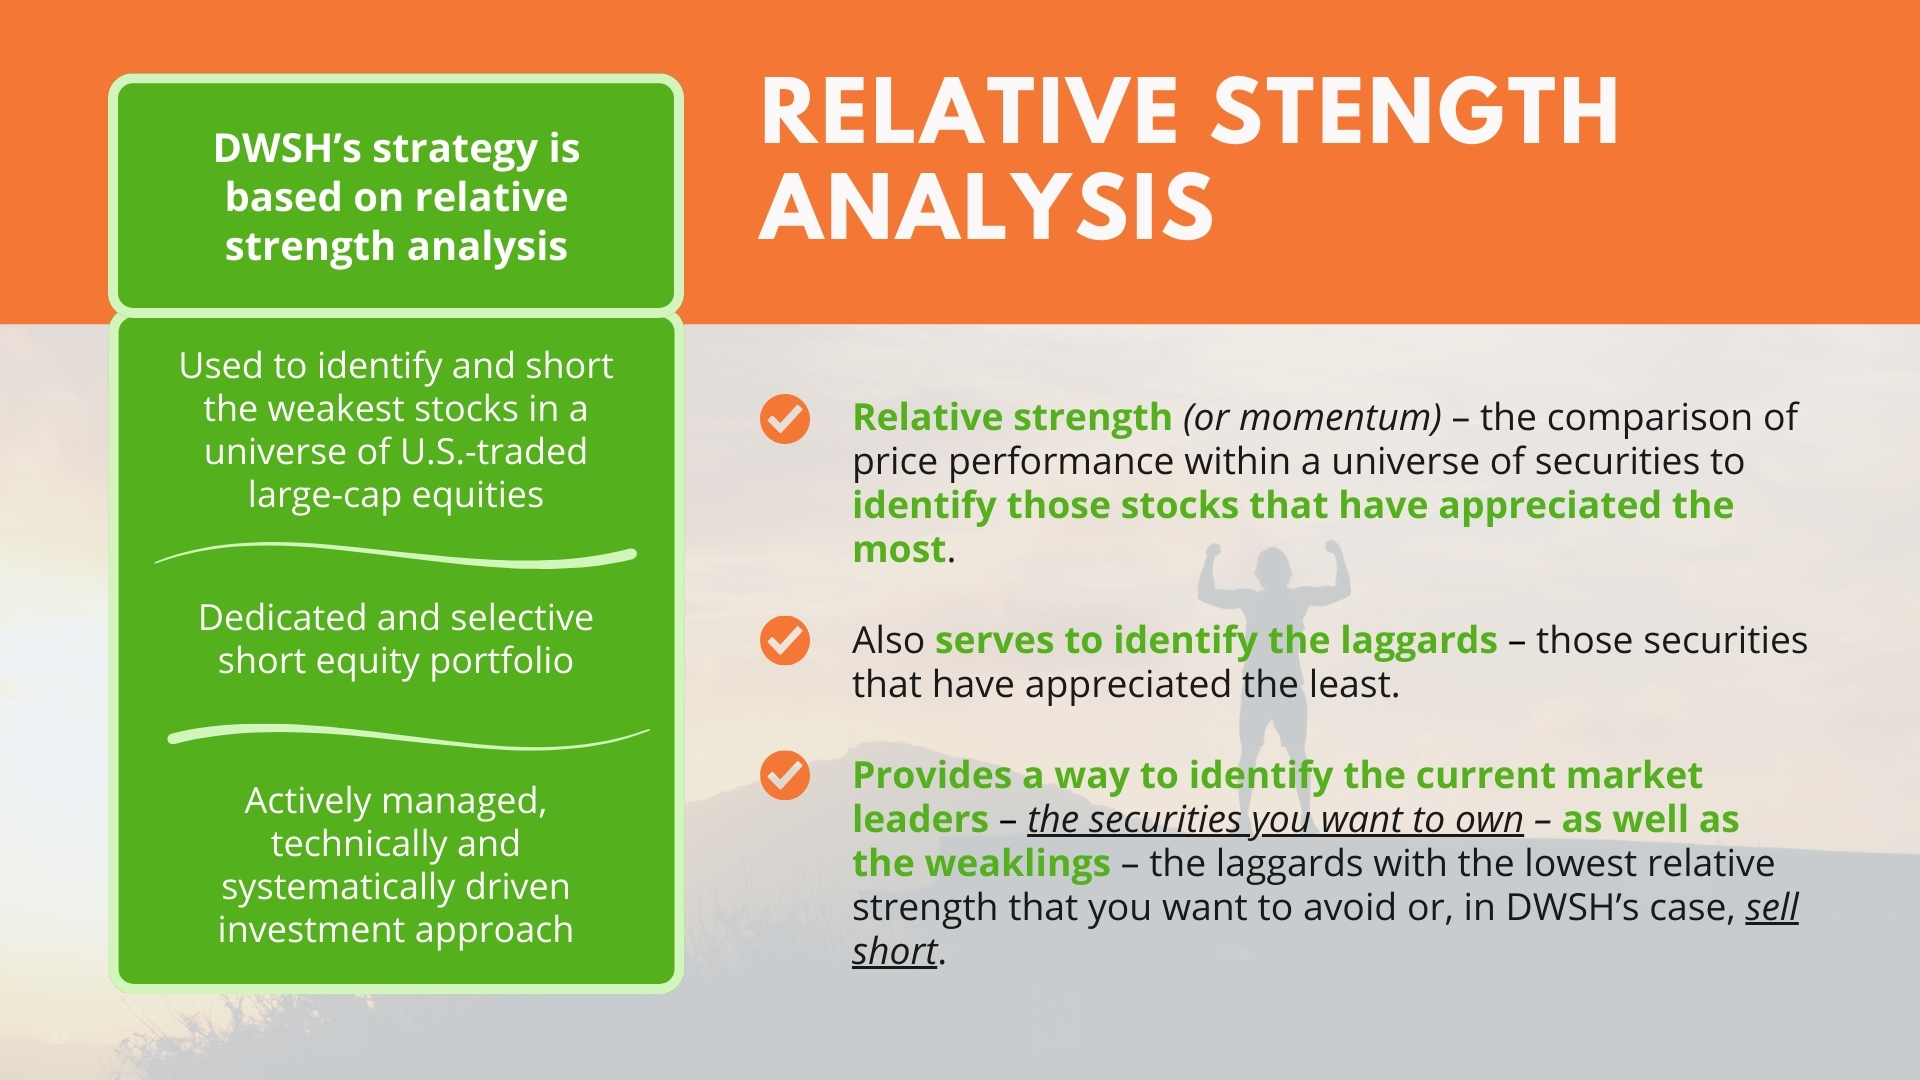
Relative strength is a way of recording historic performance patterns to identify momentum signals for current and future performance trends of a security versus an investment universe or benchmark. It is the comparison of price performance within a universe of securities to identify those that have appreciated more. Numerous studies by both academics and investment professionals have demonstrated that securities showing the greatest gains relative to their market often continue to outperform. Analyzing securities by their relative strength provides a way to identify the current market leaders – the securities leading the market and the ones you want to own. It also identifies those with the weakest relative strength – the laggards underperforming that you want to avoid or sell short. Nasdaq Dorsey Wright is recognized as a leader in relative strength analysis.
Why Invest in DWSH?
- Hedging Tool – DWSH can be implemented as part of a long/short strategy, providing investors with a “buy and hold” alternative to hedge their long domestically-traded equity exposure against market downturns.
- Alpha-Seeking Exposure – DWSH’s systematic and selective approach offers the potential to add alpha to an investment portfolio, especially during market corrections. Also, during severe market downturns and at certain technical levels, the strategy can seek to enhance its total return by allocating short exposure more broadly to the domestic equity market and shorting individual ETFs or futures contracts.
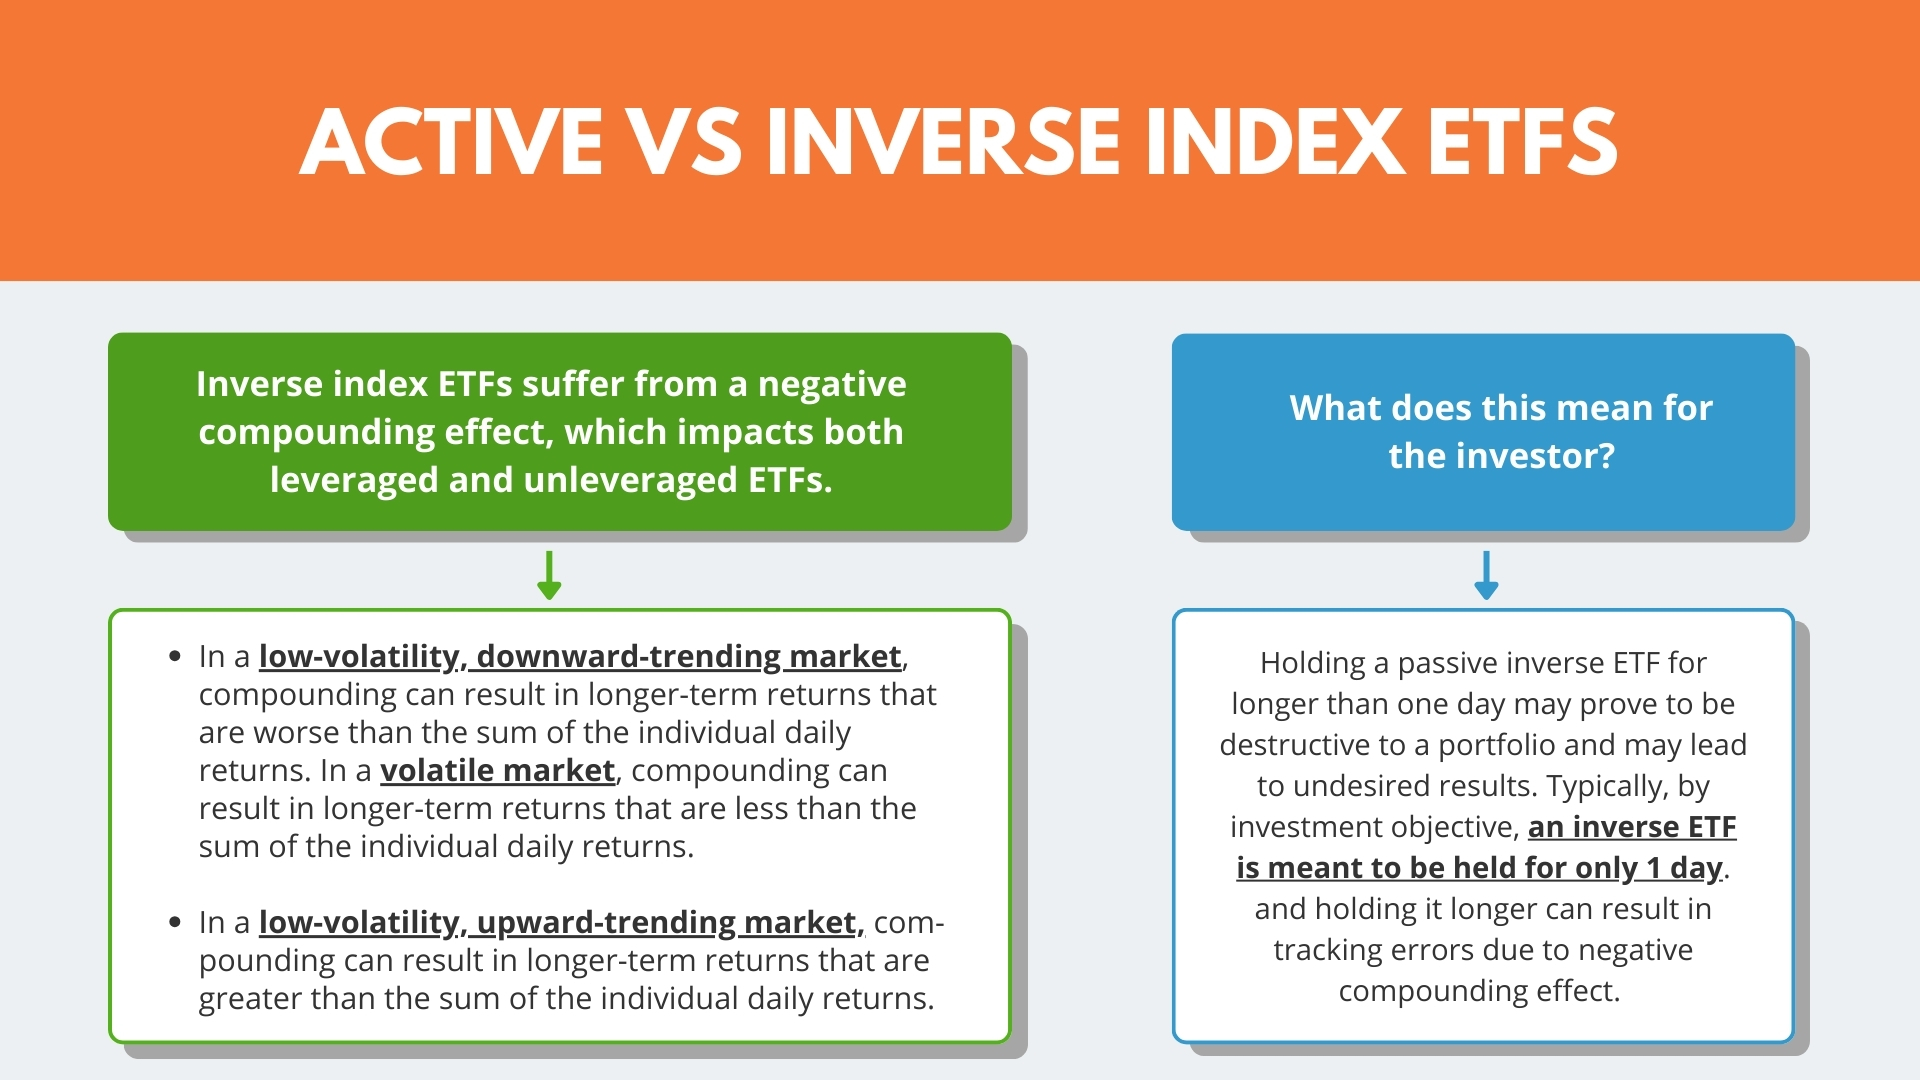
- Different from Inverse Funds – Spreading your investment risk among equities not correlated to the broader market may help diversify and mitigate your overall portfolio risk. DWSH differs considerably from inverse fund investment strategies which are often subject to daily resets and indiscriminately sell short the top companies within a market-cap weighted index.
- Strategy Diversification – DWSH’s systematic investment process seeks to limit unnecessary risk while maximizing relative weakness exposure. If a security becomes too large as a percentage of the portfolio, it is trimmed to bring it back in line with the other securities weights. The process also implements pre-determined stop prices for each position.
Where Can DWSH Fit in a Traditional Portfolio?
DWSH may be used to hedge long equity exposure and seek positive returns in declining equity markets.
Key Attributes
- Dedicated Short Portfolio of Weakest Companies – DWSH typically has a modified equal weight portfolio of 75 – 100 U.S.-traded large cap equities that demonstrate the highest relative weakness according to Nasdaq Dorsey Wright’s proprietary relative strength model.
- Systematic Approach –DWSH’s investment process is entirely systematic and designed to remove human emotion from the decision process. It allows for the ongoing analysis of a large universe of securities through diverse and changing markets.
- Relative Strength/Weakness Analysis – DWSH uses relative strength investing, a repeatable process which compares price performance within a universe of stocks. Analyzing securities by their relative strength not only identifies the current market leaders, but also those with the weakest relative strength – the laggards underperforming the market that DWSH wants to sell short.
- Disciplined Sell Process – Securities are automatically sold from the portfolio when they reach a predetermined sell price. This sell price is identified when the security is purchased and not adjusted for different market scenarios. The sell process is an entirely technical, systematic approach and takes the emotion out of the sell decision.
About the Portfolio Strategist
John G. Lewis, CMT | Nasdaq Dorsey Wright, Senior Portfolio Manager
Since joining Nasdaq Dorsey Wright in 2002, Mr. Lewis has developed relative strength and momentum strategies for the firm’s separately managed accounts, global asset allocation strategies, ETFs, and UITs. As one of the foremost experts on relative strength investing, Mr. Lewis has authored several original research papers on the subject. He is a Chartered Market Technician (CMT) and a member of the Market Technician’s Association and the American Association of Professional Technical Analysts. Mr. Lewis earned an M.B.A. in Finance from the University of Southern California and a B.A. from the University of San Diego. He began his career in the investment industry in 1994.

DWSH Overview
Get a quick and easy introduction to the DWSH ETF.
DWSH Overview
Get a quick and easy introduction to the DWSH ETF.
Fund
Price History
Fund Data
6/9/2026| NAV | $6.36 |
| Change | $-0.09 |
| Shares Outstanding | 1,720,000 |
| Assets Under Management | $10,934,931.51 |
Market Data
6/9/2026| Closing Price | $6.35 |
| Close Change | $-0.09 |
| Volume | 57,494 |
Regulatory Data
6/9/2026| Premium Discount | $-0.01 |
| 30-Day Median bid-ask Spread | 0.004591 |
Shares are bought and sold at market price (closing price) not NAV and are not individually redeemed from the Fund. Market price returns are based on the midpoint of the bid/ask spread at 4:00 pm Eastern Time (when NAV is normally determined), and do not represent the return you would receive if you traded at other times.
")
FUND
Characteristics
As of 5/31/2026
Source: Morningstar & AdvisorShares
FUND
Performance
As of 5/31/2026
| NAV | Market Price Return | S&P 500 Index | |
|---|---|---|---|
| 1 Month | -1.19 | -0.94 | 5.26 |
| 3 Months | 2.66 | 2.75 | 10.52 |
| YTD | -1.73 | -1.40 | 11.27 |
| 1 Year | -14.03 | -13.99 | 29.78 |
| 3 Years | -6.40 | -6.40 | 23.61 |
| 5 Years | -2.06 | -2.10 | 14.15 |
| Since Inception (7/10/2018, Annualized) | -13.54 | -13.55 | 15.31 |
As of 3/31/2026
| NAV | Market Price Return | S&P 500 Index | |
|---|---|---|---|
| 1 Month | 6.21 | 6.15 | -4.98 |
| 3 Months | 1.67 | 1.86 | -4.33 |
| YTD | 1.67 | 1.86 | -4.33 |
| 1 Year | -6.87 | -7.00 | 17.80 |
| 3 Years | -3.28 | -3.33 | 18.32 |
| 5 Years | -2.50 | -2.48 | 12.06 |
| Since Inception (7/10/2018, Annualized) | -13.43 | -13.46 | 13.43 |
Performance data quoted represents past performance and is no guarantee of future results. All Fund data and performance data quoted is believed to be accurate, and unless otherwise stated, is sourced from the Fund administrator, the Advisor’s or Sub-Advisor’s proprietary data, and Morningstar. Current performance may be lower or higher than the performance data quoted. Investment return and principal value will fluctuate so that an investor’s shares, when redeemed, may be worth more or less than original cost. Returns less than one year are not annualized.
Get Social @AdvisorShares
Join the conversation on social media to hear more from the portfolio manager, get informed about upcoming events and webinars, and more!
| Date | Account Symbol | Stock Ticker | Security ID | Security Description | Shares | Share Price | Market Value | Portfolio Weight | Asset Group |
|---|---|---|---|---|---|---|---|---|---|
| 06/09/2026 | DWSH | MOH | 60855R100 | MOLINA HEALTHCARE INC | -917 | 203.06 | -186,206.02 | -1.70% | S |
| VNO | 929042109 | VORNADO REALTY TRUST | -4,065 | 38.45 | -156,299.25 | -1.43% | S | ||
| FDS | 303075105 | FACTSET RESEARCH SYSTEMS INC | -581 | 246.07 | -142,966.67 | -1.31% | S | ||
| GEN | 668771108 | GEN DIGITAL INC | -5,660 | 24.97 | -141,330.20 | -1.29% | S | ||
| JEF | 47233W109 | JEFFERIES FINANCIAL GROUP IN | -2,340 | 59.03 | -138,130.20 | -1.26% | S | ||
| MORN | 617700109 | MORNINGSTAR INC | -740 | 184.66 | -136,648.40 | -1.25% | S | ||
| GPK | 388689101 | GRAPHIC PACKAGING HOLDING CO | -12,500 | 10.79 | -134,875.00 | -1.23% | S | ||
| CDW | 12514G108 | CDW CORP/DE | -1,010 | 133.33 | -134,663.30 | -1.23% | S | ||
| ALK | 011659109 | ALASKA AIR GROUP INC | -2,930 | 45.13 | -132,230.90 | -1.21% | S | ||
| CBRL | 22410J106 | CRACKER BARREL OLD COUNTRY | -3,640 | 36.30 | -132,132.00 | -1.21% | S | ||
| FBIN | 34964C106 | FORTUNE BRANDS INNOVATIONS I | -3,170 | 41.29 | -130,889.30 | -1.20% | S | ||
| PAYC | 70432V102 | PAYCOM SOFTWARE INC | -950 | 136.14 | -129,333.00 | -1.18% | S | ||
| TRIP | 896945201 | TRIPADVISOR INC | -10,700 | 11.95 | -127,865.00 | -1.17% | S | ||
| BAX | 071813109 | BAXTER INTERNATIONAL INC | -6,250 | 20.03 | -125,187.50 | -1.14% | S | ||
| KMX | 143130102 | CARMAX INC | -2,580 | 48.01 | -123,865.80 | -1.13% | S | ||
| DEI | 25960P109 | DOUGLAS EMMETT INC | -9,735 | 12.63 | -122,953.05 | -1.12% | S | ||
| SNAP | 83304A106 | SNAP INC - A | -21,890 | 5.59 | -122,365.10 | -1.12% | S | ||
| PODD | 45784P101 | INSULET CORP | -760 | 159.61 | -121,303.60 | -1.11% | S | ||
| OC | 690742101 | OWENS CORNING | -985 | 122.90 | -121,056.50 | -1.11% | S | ||
| RHI | 770323103 | ROBERT HALF INC | -3,940 | 30.70 | -120,958.00 | -1.11% | S | ||
| PRGO | G97822103 | PERRIGO CO PLC | -10,720 | 11.18 | -119,849.60 | -1.10% | FS | ||
| UHAL | 023586100 | U-HAUL HOLDING CO | -1,940 | 61.76 | -119,814.40 | -1.10% | S | ||
| AJG | 363576109 | ARTHUR J GALLAGHER & CO | -552 | 217.05 | -119,811.60 | -1.10% | S | ||
| ERIE | 29530P102 | ERIE INDEMNITY COMPANY-CL A | -520 | 228.62 | -118,882.40 | -1.09% | S | ||
| PYPL | 70450Y103 | PAYPAL HOLDINGS INC | -2,850 | 41.46 | -118,161.00 | -1.08% | S | ||
| SLG | 78440X887 | SL GREEN REALTY CORP | -2,280 | 51.53 | -117,488.40 | -1.07% | S | ||
| MAN | 56418H100 | MANPOWERGROUP INC | -3,576 | 32.65 | -116,756.40 | -1.07% | S | ||
| LEN | 526057104 | LENNAR CORP-A | -1,250 | 92.56 | -115,700.00 | -1.06% | S | ||
| EFOR | 00191U102 | EVERFORTH INC | -5,630 | 20.52 | -115,527.60 | -1.06% | S | ||
| THO | 885160101 | THOR INDUSTRIES INC | -1,450 | 78.81 | -114,274.50 | -1.04% | S | ||
| GT | 382550101 | GOODYEAR TIRE & RUBBER CO | -19,300 | 5.90 | -113,870.00 | -1.04% | S | ||
| CHTR | 16119P108 | CHARTER COMMUNICATIONS INC-A | -840 | 135.37 | -113,710.80 | -1.04% | S | ||
| NUS | 67018T105 | NU SKIN ENTERPRISES INC - A | -20,900 | 5.44 | -113,696.00 | -1.04% | S | ||
| IT | 366651107 | GARTNER INC | -720 | 157.40 | -113,328.00 | -1.04% | S | ||
| KMB | 494368103 | KIMBERLY-CLARK CORP | -1,125 | 100.52 | -113,085.00 | -1.03% | S | ||
| VYX | 62886E108 | NCR VOYIX CORP | -16,080 | 6.99 | -112,399.20 | -1.03% | S | ||
| TSCO | 892356106 | TRACTOR SUPPLY COMPANY | -3,750 | 29.96 | -112,350.00 | -1.03% | S | ||
| NOW | 81762P102 | SERVICENOW INC | -1,045 | 106.97 | -111,783.65 | -1.02% | S | ||
| BSX | 101137107 | BOSTON SCIENTIFIC CORP | -2,280 | 48.96 | -111,628.80 | -1.02% | S | ||
| FICO | 303250104 | FAIR ISAAC CORP | -91 | 1,225.15 | -111,488.65 | -1.02% | S | ||
| ABT | 002824100 | ABBOTT LABORATORIES | -1,220 | 91.25 | -111,325.00 | -1.02% | S | ||
| IP | 460146103 | INTERNATIONAL PAPER CO | -3,250 | 34.12 | -110,890.00 | -1.01% | S | ||
| HRB | 093671105 | H&R BLOCK INC | -2,890 | 38.26 | -110,571.40 | -1.01% | S | ||
| XRAY | 24906P109 | DENTSPLY SIRONA INC | -10,556 | 10.47 | -110,521.32 | -1.01% | S | ||
| SLM | 78442P106 | SLM CORP | -4,750 | 23.05 | -109,487.50 | -1.00% | S | ||
| GIS | 370334104 | GENERAL MILLS INC | -3,240 | 33.72 | -109,252.80 | -1.00% | S | ||
| BBWI | 070830104 | BATH & BODY WORKS INC | -5,950 | 18.30 | -108,885.00 | -1.00% | S | ||
| CTSH | 192446102 | COGNIZANT TECH SOLUTIONS-A | -2,050 | 52.94 | -108,527.00 | -0.99% | S | ||
| NKE | 654106103 | NIKE INC -CL B | -2,430 | 44.65 | -108,499.50 | -0.99% | S | ||
| ENOV | 194014502 | ENOVIS CORP | -4,515 | 23.96 | -108,179.40 | -0.99% | S | ||
| MKC | 579780206 | MCCORMICK & CO-NON VTG SHRS | -2,220 | 48.63 | -107,958.60 | -0.99% | S | ||
| ZBRA | 989207105 | ZEBRA TECHNOLOGIES CORP-CL A | -460 | 234.20 | -107,732.00 | -0.99% | S | ||
| ADBE | 00724F101 | ADOBE INC | -445 | 237.88 | -105,856.60 | -0.97% | S | ||
| VEEV | 922475108 | VEEVA SYSTEMS INC-CLASS A | -630 | 167.68 | -105,638.40 | -0.97% | S | ||
| INTU | 461202103 | INTUIT INC | -355 | 293.78 | -104,291.90 | -0.95% | S | ||
| CPB | 134429109 | THE CAMPBELL'S COMPANY | -4,690 | 22.13 | -103,789.70 | -0.95% | S | ||
| OI | 67098H104 | O-I GLASS INC | -12,400 | 8.32 | -103,168.00 | -0.94% | S | ||
| BAH | 099502106 | BOOZ ALLEN HAMILTON HOLDINGS | -1,315 | 78.35 | -103,030.25 | -0.94% | S | ||
| ARE | 015271109 | ALEXANDRIA REAL ESTATE EQUIT | -1,945 | 52.95 | -102,987.75 | -0.94% | S | ||
| LW | 513272104 | LAMB WESTON HOLDINGS INC | -2,360 | 43.55 | -102,778.00 | -0.94% | S | ||
| WDAY | 98138H101 | WORKDAY INC-CLASS A | -730 | 140.23 | -102,367.90 | -0.94% | S | ||
| CAG | 205887102 | CONAGRA BRANDS INC | -7,720 | 13.14 | -101,440.80 | -0.93% | S | ||
| SRPT | 803607100 | SAREPTA THERAPEUTICS INC | -6,300 | 15.89 | -100,107.00 | -0.92% | S | ||
| CPRT | 217204106 | COPART INC | -3,170 | 31.31 | -99,252.70 | -0.91% | S | ||
| NWL | 651229106 | NEWELL BRANDS INC | -22,260 | 4.41 | -98,166.60 | -0.90% | S | ||
| EEFT | 298736109 | EURONET WORLDWIDE INC | -1,485 | 65.68 | -97,534.80 | -0.89% | S | ||
| BR | 11133T103 | BROADRIDGE FINANCIAL SOLUTIO | -650 | 150.04 | -97,526.00 | -0.89% | S | ||
| PAYX | 704326107 | PAYCHEX INC | -970 | 100.28 | -97,271.60 | -0.89% | S | ||
| CXT | 224441105 | CRANE NXT CO | -2,530 | 38.25 | -96,772.50 | -0.88% | S | ||
| FLO | 343498101 | FLOWERS FOODS INC | -12,630 | 7.66 | -96,745.80 | -0.88% | S | ||
| CABO | 12685J105 | CABLE ONE INC | -2,302 | 41.96 | -96,591.92 | -0.88% | S | ||
| BFAM | 109194100 | BRIGHT HORIZONS FAMILY SOLUT | -1,570 | 61.51 | -96,570.70 | -0.88% | S | ||
| ZTS | 98978V103 | ZOETIS INC | -1,150 | 82.20 | -94,530.00 | -0.86% | S | ||
| BRO | 115236101 | BROWN & BROWN INC | -1,575 | 59.11 | -93,098.25 | -0.85% | S | ||
| FND | 339750101 | FLOOR & DECOR HOLDINGS INC-A | -1,870 | 49.74 | -93,013.80 | -0.85% | S | ||
| CHE | 16359R103 | CHEMED CORP | -208 | 446.26 | -92,822.08 | -0.85% | S | ||
| ROP | 776696106 | ROPER TECHNOLOGIES INC | -275 | 335.37 | -92,226.75 | -0.84% | S | ||
| CSGP | 22160N109 | COSTAR GROUP INC | -2,690 | 33.93 | -91,271.70 | -0.83% | S | ||
| Z | 98954M200 | ZILLOW GROUP INC - C | -2,570 | 35.45 | -91,106.50 | -0.83% | S | ||
| FMC | 302491303 | FMC CORP | -7,703 | 11.50 | -88,584.50 | -0.81% | S | ||
| FISV | 337738108 | FISERV INC | -1,630 | 54.03 | -88,068.90 | -0.81% | S | ||
| CRM | 79466L302 | SALESFORCE INC | -500 | 175.35 | -87,675.00 | -0.80% | S | ||
| CMG | 169656105 | CHIPOTLE MEXICAN GRILL INC | -2,920 | 29.88 | -87,249.60 | -0.80% | S | ||
| WHR | 963320106 | WHIRLPOOL CORP | -2,100 | 41.44 | -87,024.00 | -0.80% | S | ||
| FIS | 31620M106 | FIDELITY NATIONAL INFO SERV | -2,145 | 39.98 | -85,757.10 | -0.78% | S | ||
| ACM | 00766T100 | AECOM | -1,190 | 71.29 | -84,835.10 | -0.78% | S | ||
| OLED | 91347P105 | UNIVERSAL DISPLAY CORP | -940 | 89.32 | -83,960.80 | -0.77% | S | ||
| WEN | 95058W100 | WENDY'S CO/THE | -12,430 | 6.71 | -83,405.30 | -0.76% | S | ||
| EFX | 294429105 | EQUIFAX INC | -490 | 168.37 | -82,501.30 | -0.75% | S | ||
| ACN | G1151C101 | ACCENTURE PLC-CL A | -475 | 173.47 | -82,398.25 | -0.75% | FS | ||
| BLKB | 09227Q100 | BLACKBAUD INC | -2,900 | 27.86 | -80,794.00 | -0.74% | S | ||
| GDDY | 380237107 | GODADDY INC - CLASS A | -960 | 81.57 | -78,307.20 | -0.72% | S | ||
| VRSK | 92345Y106 | VERISK ANALYTICS INC | -420 | 182.55 | -76,671.00 | -0.70% | S | ||
| POOL | 73278L105 | POOL CORP | -395 | 192.42 | -76,005.90 | -0.70% | S | ||
| GWRE | 40171V100 | GUIDEWIRE SOFTWARE INC | -610 | 124.51 | -75,951.10 | -0.69% | S | ||
| EPAM | 29414B104 | EPAM SYSTEMS INC | -750 | 95.65 | -71,737.50 | -0.66% | S | ||
| TYL | 902252105 | TYLER TECHNOLOGIES INC | -230 | 308.92 | -71,051.60 | -0.65% | S | ||
| GPN | 37940X102 | GLOBAL PAYMENTS INC | -1,100 | 63.81 | -70,191.00 | -0.64% | S | ||
| DXC | 23355L106 | DXC TECHNOLOGY CO | -7,530 | 8.85 | -66,640.50 | -0.61% | S | ||
| X9USDISLQ | INVESCO GOVT AGENCY INSTL 1901 | 9,459,659.3 | 1.00 | 9,459,659.30 | 86.50% | MM | |||
| CASH | 12,041,282.2 | 100.00 | 12,041,282.20 | 110.11% | CA |
FUND
Fees & Expenses
Annual Fund Operating Expenses (expenses that you pay each year as a percentage of the value of your investment)
| Management Fee | 0.75% | ||
| Other Expenses | 5.55% | ||
| Short Interest Expenses | 4.61% | ||
| Remaining Expenses | 0.94% | ||
| Acquired Fund Fees and Expenses* | 0.36% | ||
| Gross Expense Ratio | 6.66% | ||
| Fee Waiver/Expense Reimbursement* | -0.44% | ||
| Net Expense Ratio | 6.22% |
| Expense Cap Limitation* | 1.25% |
*Total Annual Operating Expenses and Total Annual Operating Expenses After Waiver/Reimbursement in this fee table may not correlate to the expense ratios in the Fund’s financial highlights because the financial highlights include only the Fund’s direct operating expenses and do not include Acquired Fund Fees and Expenses, which represent the Fund’s pro rata share of the fees and expenses of any money market fund and/or affiliated ETF in which it invested. Total Annual Operating Expenses and Total Annual Operating Expenses After Recapture in this fee table may not correlate to the expense ratios in the Fund’s financial highlights. The Advisor has contractually agreed to reduce its fees and/or reimburse expenses to keep net expenses from exceeding 1.25% of the Fund’s average daily net assets for at least one year from the date of the Prospectus. For more information, please read the full prospectus.
Last Ten
Fund Distributions
")
-
-
-
-
Definitions:
Alpha: One of the most commonly quoted indicators of investment performance, alpha, is defined as the excess return on an investment relative to the return on a benchmark index.
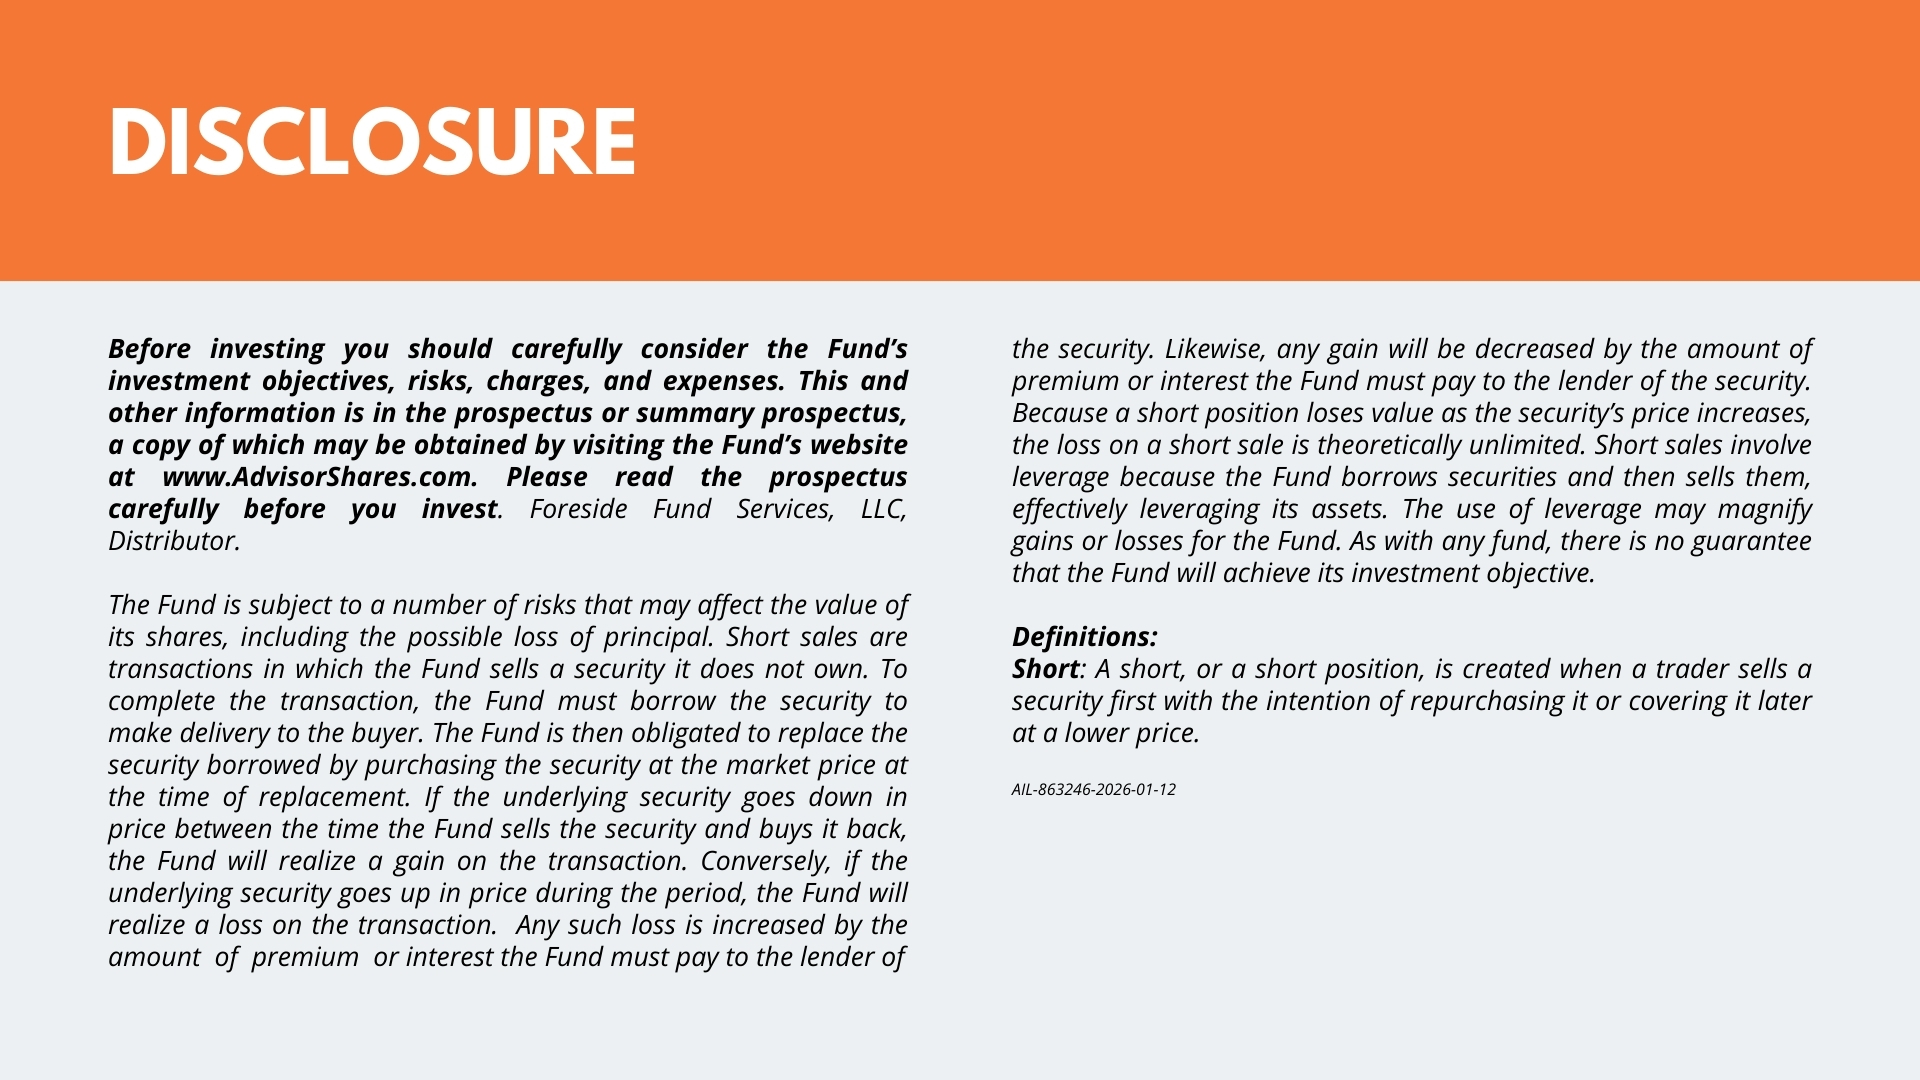
Short: A short, or a short position, is created when a trader sells a security first with the intention of repurchasing it or covering it later at a lower price.
Before investing you should carefully consider the Fund’s investment objectives, risks, charges, and expenses. This and other information is in the prospectus or summary prospectus, a copy of which may be obtained by visiting the Fund’s website at www.AdvisorShares.com. Please read the prospectus carefully before you invest. Foreside Fund Services, LLC, Distributor.
The Fund is subject to a number of risks that may affect the value of its shares, including the possible loss of principal. Short sales are transactions in which the Fund sells a security it does not own. To complete the transaction, the Fund must borrow the security to make delivery to the buyer. The Fund is then obligated to replace the security borrowed by purchasing the security at the market price at the time of replacement. If the underlying security goes down in price between the time the Fund sells the security and buys it back, the Fund will realize a gain on the transaction. Conversely, if the underlying security goes up in price during the period, the Fund will realize a loss on the transaction. Any such loss is increased by the amount of premium or interest the Fund must pay to the lender of the security. Likewise, any gain will be decreased by the amount of premium or interest the Fund must pay to the lender of the security. Because a short position loses value as the security’s price increases, the loss on a short sale is theoretically unlimited. Short sales involve leverage because the Fund borrows securities and then sells them, effectively leveraging its assets. The use of leverage may magnify gains or losses for the Fund. As with any fund, there is no guarantee that the Fund will achieve its investment objective.
-
-
-
ETF Social Conversation