

| Symbol | Exchange | Inception Date | CUSIP | NAV | Indicative Value | Options Available |
|---|---|---|---|---|---|---|
| HDGE | NYSE Arca | 1/26/2011 | 00768Y 412 | HDGE.NV | HDGE.IV | Yes |
About The ETF
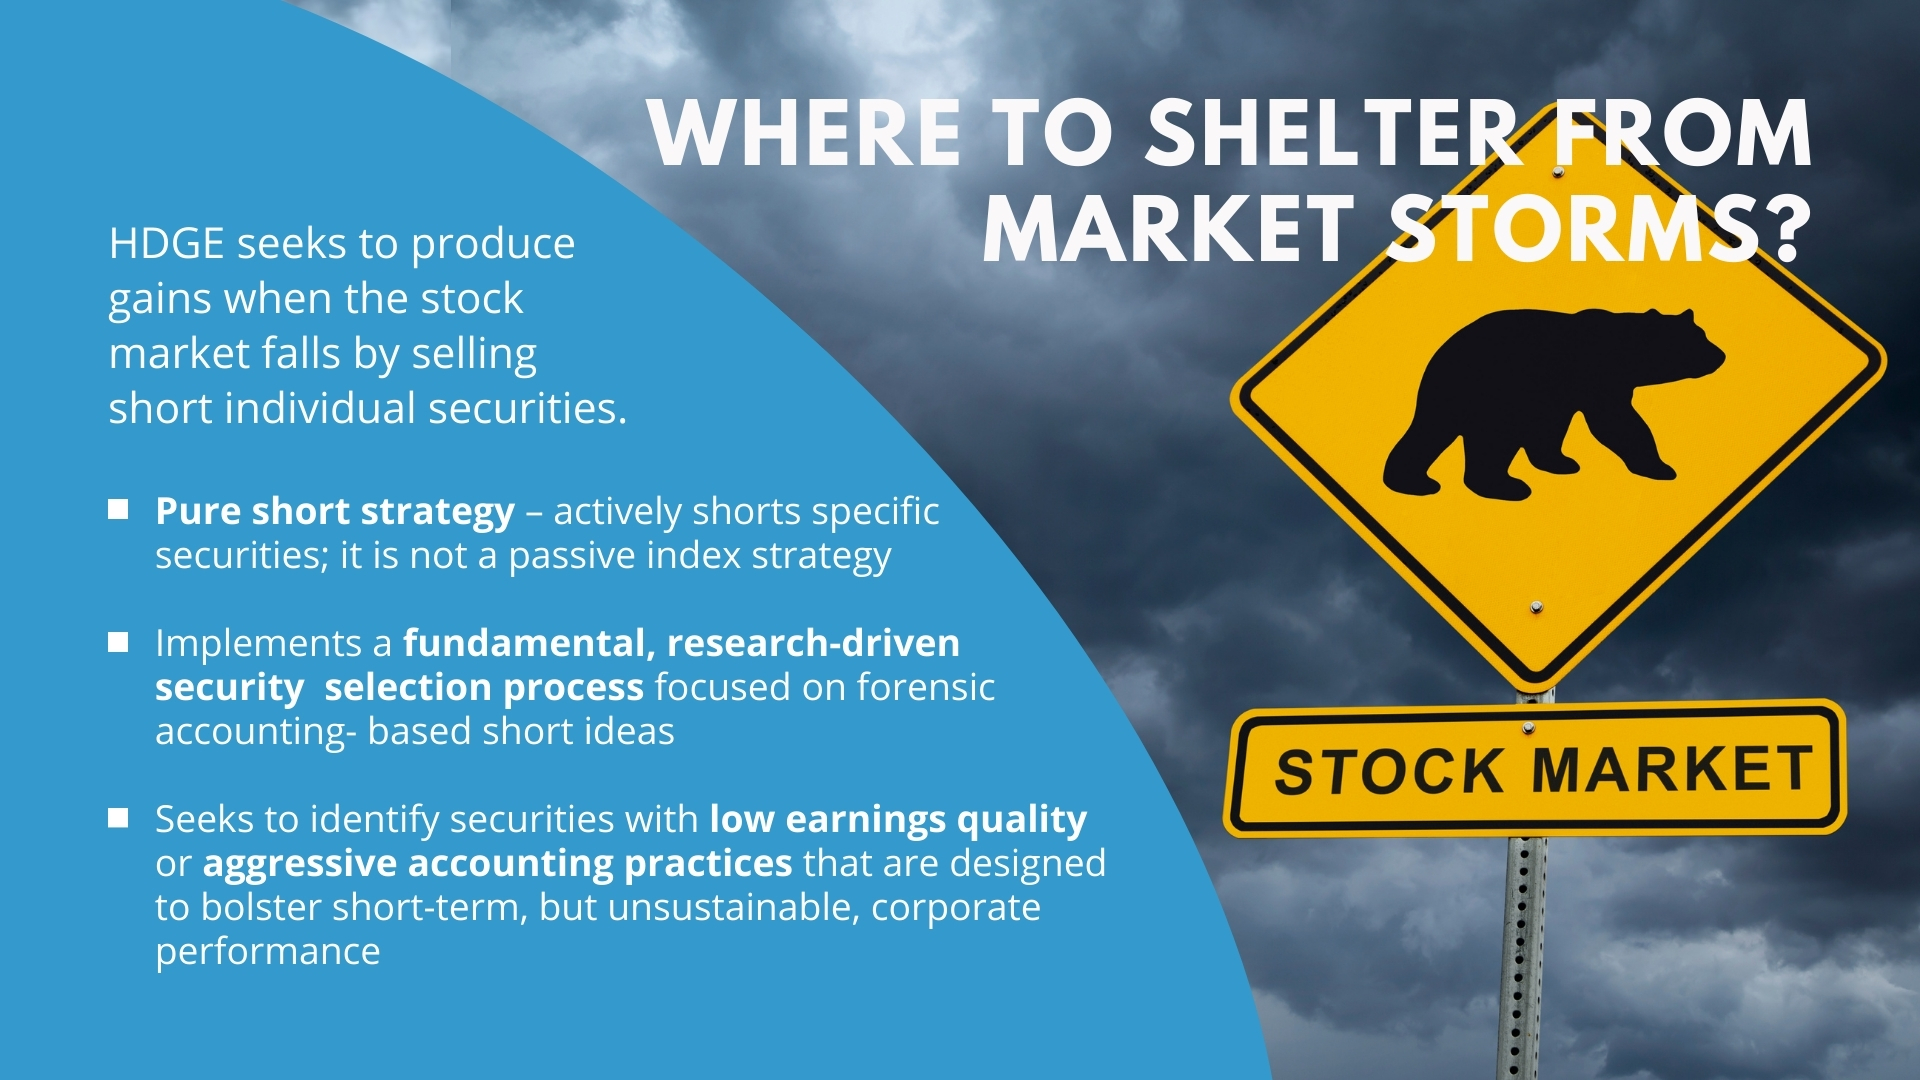
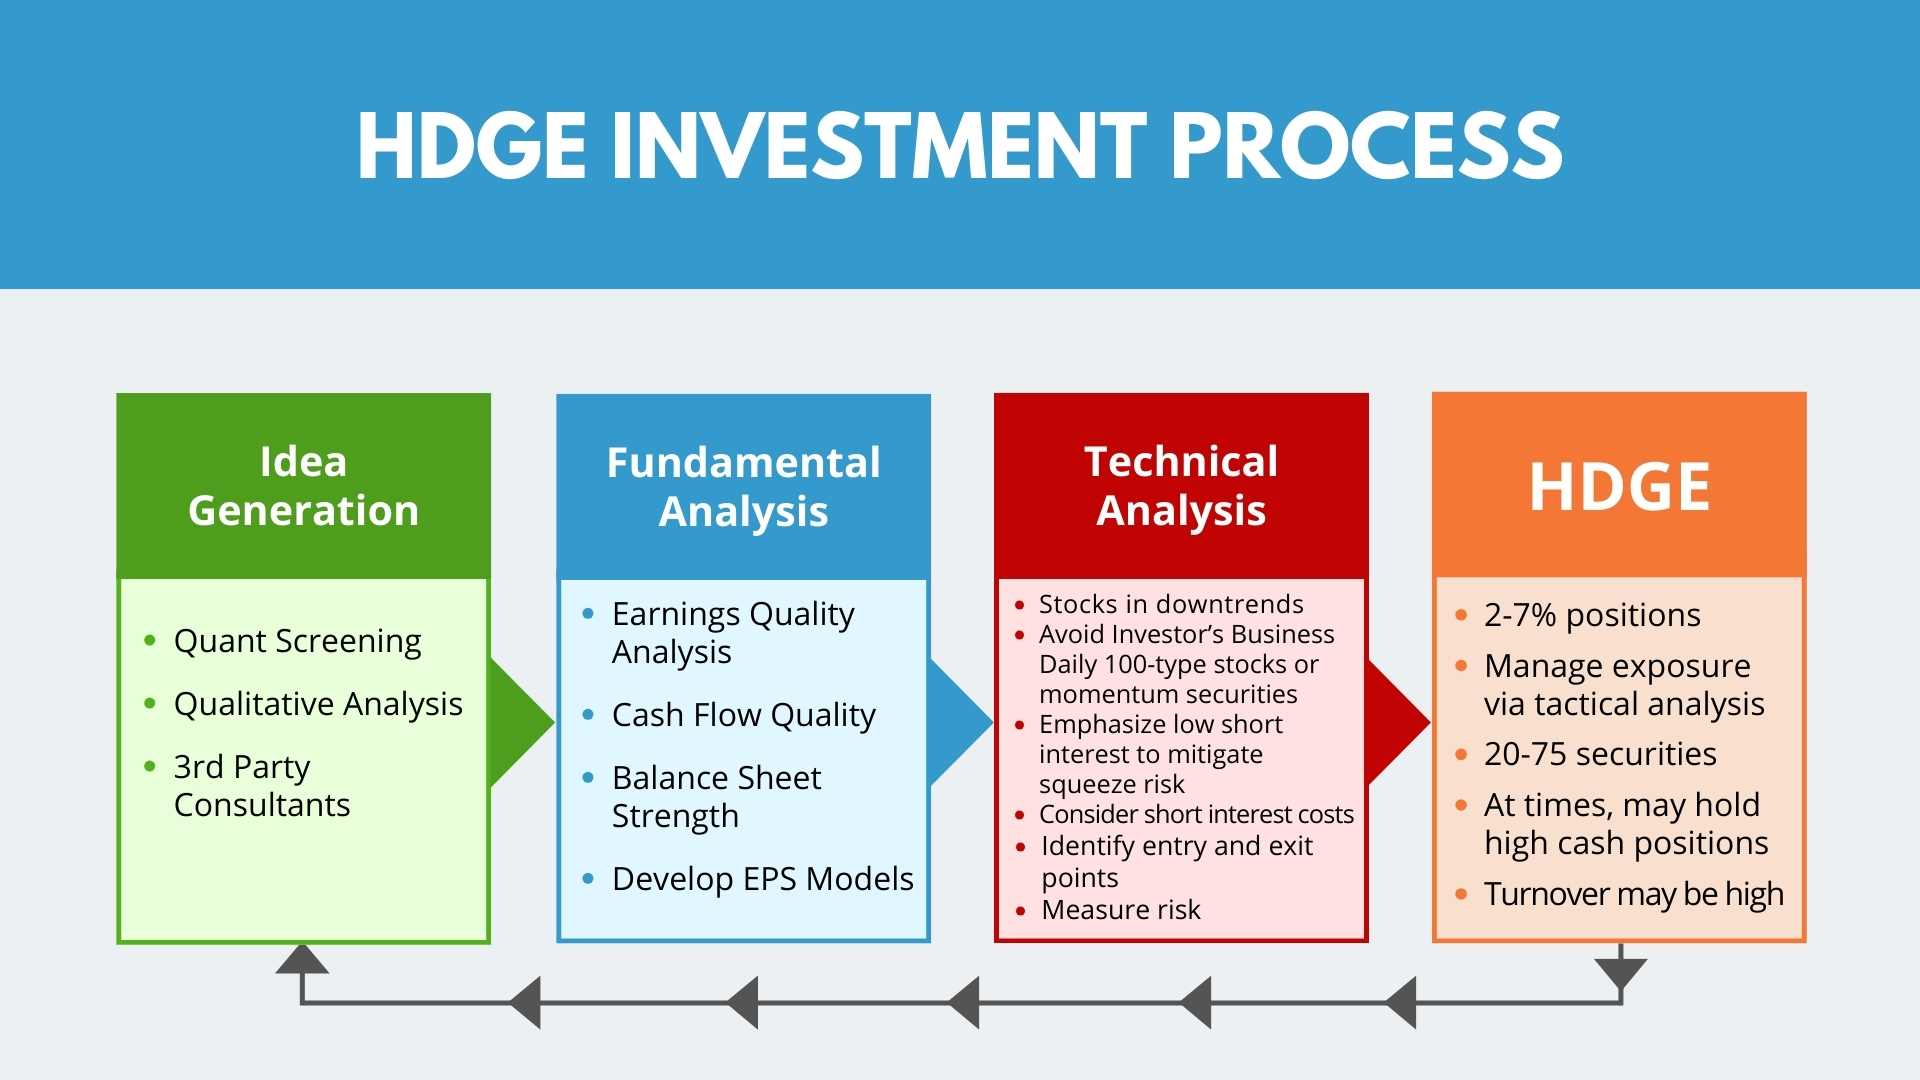
The investment objective of the AdvisorShares Ranger Equity Bear ETF (NYSE Arca: HDGE) is capital appreciation through short sales of domestically traded equity securities. HDGE is sub-advised by Ranger Alternative Management, L.P. (“Portfolio Manager”). The Portfolio Manager implements a bottom-up, fundamental, research driven security selection process. In selecting short positions, the Fund seeks to identify securities with low earnings quality or aggressive accounting which may be intended on the part of company management to mask operational deterioration and bolster the reported earnings per share over a short time period. In addition, the Portfolio Manager seeks to identify earnings driven events that may act as a catalyst to the price decline of a security, such as downwards earnings revisions or reduced forward guidance.
Why Invest in HDGE?
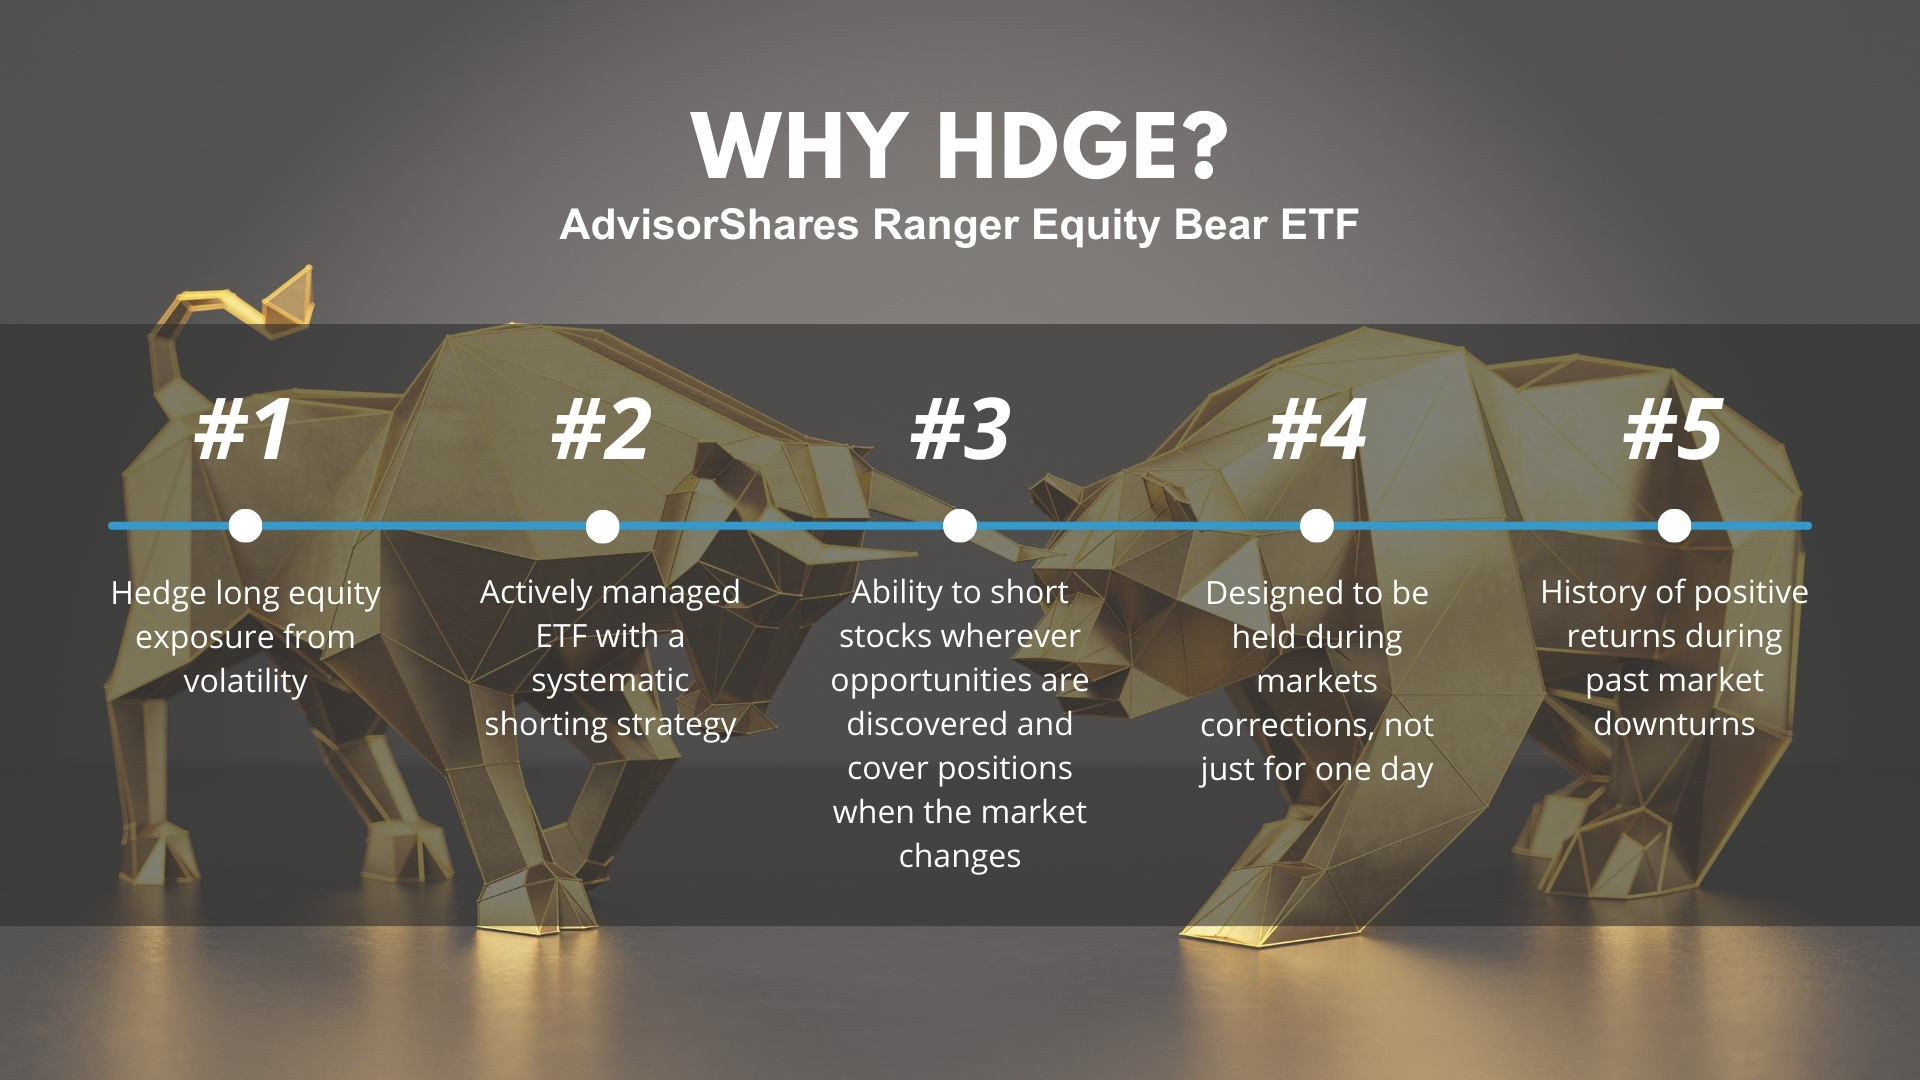
- As a Tool to Hedge Equity Exposure – HDGE can be used as part of a long/short strategy in which an investor may synthetically integrate by pairing HDGE with a long-index ETF (or an investor’s portfolio of long positions), providing the investor with a “buy and hold” option to hedge their long domestically-traded equity exposure.
- For Diversified Portfolio Construction – The Portfolio Manager’s portfolio construction process emphasizes diversification across a number of industries and specific companies with a special focus on catalysts that drive lower stock returns. The portfolio typically consists of between 20-75 equity short positions, with an average position size of between 2% and 7% of the portfolio exposure.
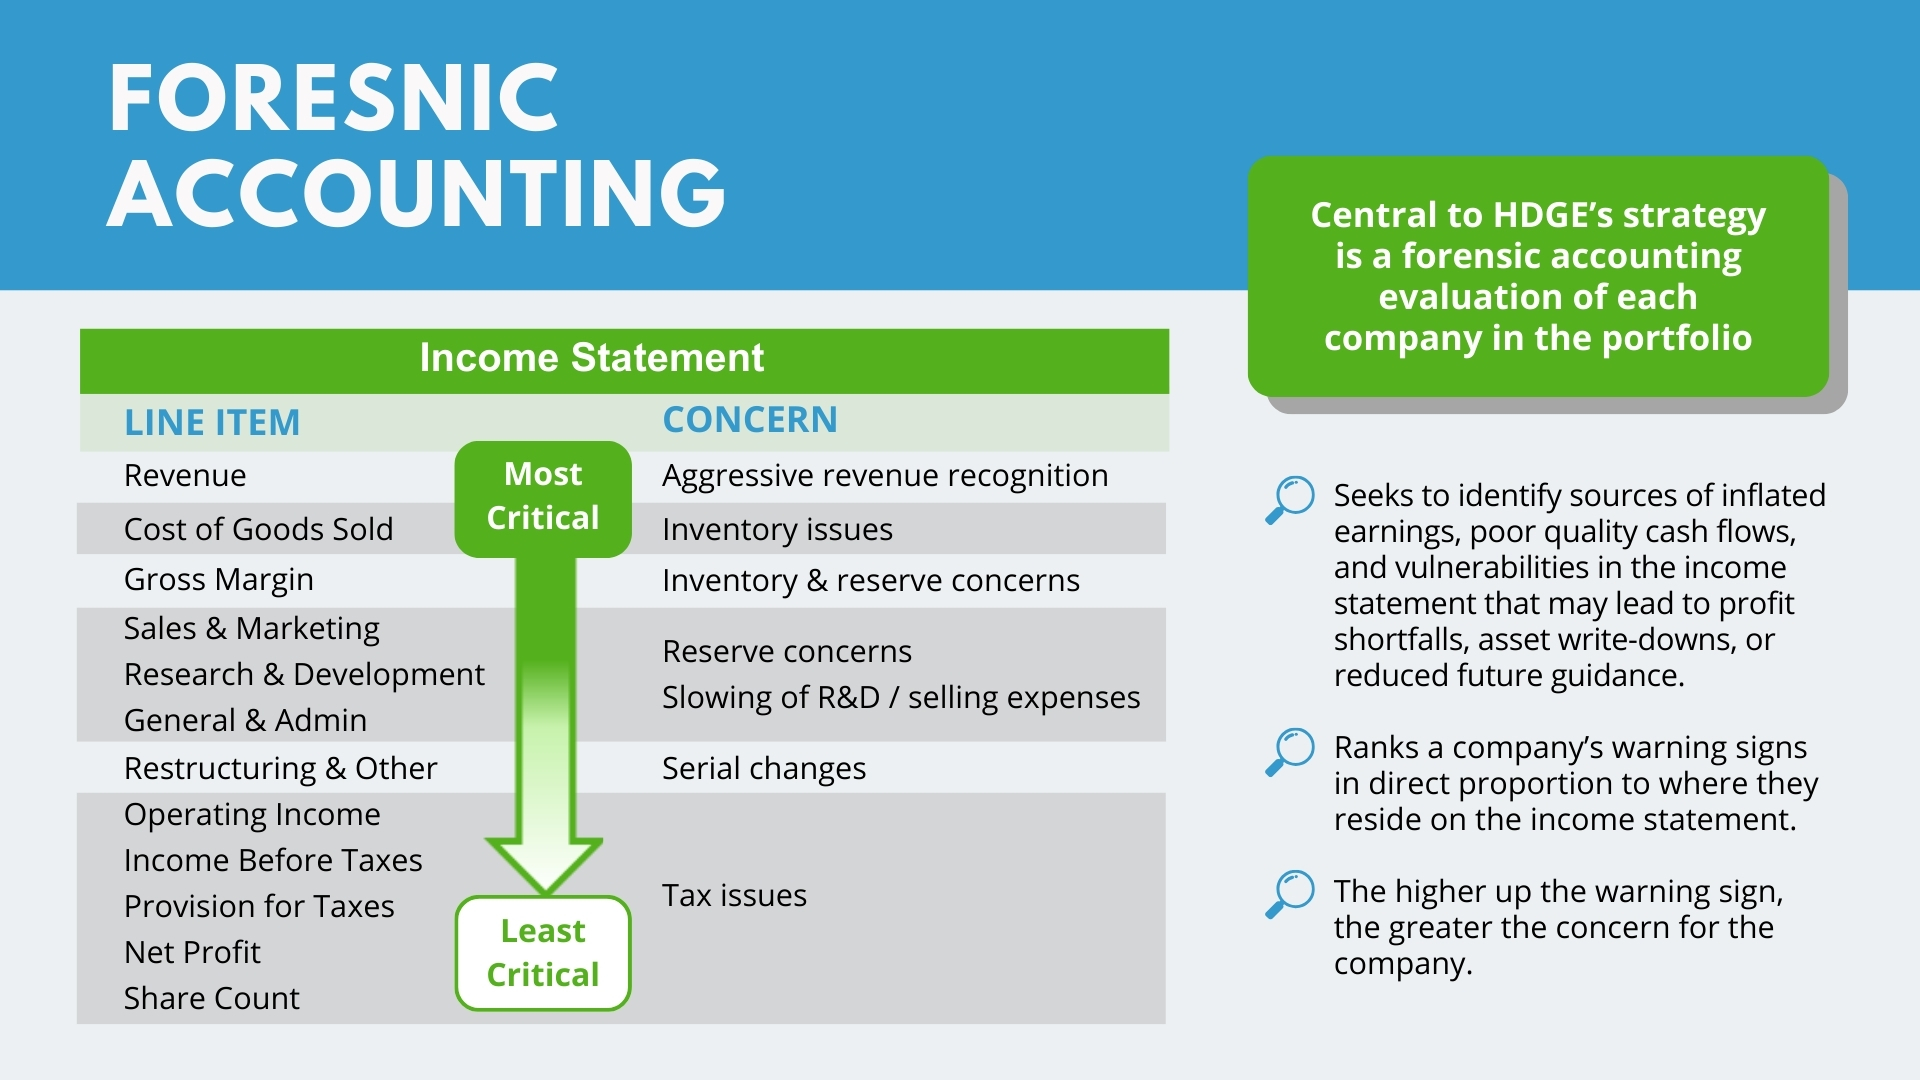
- For a Fundamental Investment Process – The Portfolio Manager utilizes accounting metrics across the income statement, cash flow statement and balance sheet to identify companies with low earnings quality or possible aggressive accounting practices. These factors may suggest operational deterioration in a company’s business. Qualitative analysis is also considered. An assessment of the management team, accounting practices, corporate governance and the company’s competitive advantage are analyzed before a company is included as part of the HDGE portfolio.
Key Attributes
- Disciplined, Repeatable Investment Process – The forensic accounting based methodology the Portfolio Manager utilizes is a disciplined, consistent investment approach to both security selection and risk management. Like an investigative auditor, a forensic accountant dissects a company’s financial statements, crunching the numbers searching for evidence in the data that may suggest operational deterioration or manipulative sales and revenue recognition, rather than focusing on fad products or broken business models to identify domestically-traded equity stocks that are expected to underperform.
- Experience – The Portfolio Manager has experience trading and managing short portfolios with the ability to tactically allocate to liquid, low short interest stocks of companies which may be masking operational deterioration.
- Market Analysis – Top-down technical evaluation of broader market liquidity, sentiment and breadth is utilized to help identify short and intermediate term market trends, manage exposure and mitigate risk.
- Specialized Strategy – Effectively shorting individual securities requires an approach very different from a traditional long-only strategy. HDGE is a very specialized product managed by investment professionals with years of short selling experience as opposed to another fund that might not have the HDGE ETF Product Manager’s shorting expertise.
About the Portfolio Manager
John Del Vecchio, CFA – Portfolio Manager/Principal
Mr. Del Vecchio serves as a Portfolio Manager for Ranger Alternative Management, L.P. (“Ranger”). Mr. Del Vecchio managed short only portfolios for Ranger from October, 2007 through March, 2010. He also serves as principal and founder of Parabolix Research, LLC, a short-only research firm. From 2003-2007, Mr. Del Vecchio served as an Analyst with David W. Tice & Associates / Behind the Numbers, LLC selecting short sale opportunities utilizing forensic accounting research on behalf of institutional clients and the Prudent Bear Fund. In 2002, Mr. Del Vecchio served as a portfolio manager for RedHawk Advisors, LLC with responsibility for managing the short sale allocation of the fund. In 2001, Mr. Del Vecchio served as an Analyst for the Center for Financial Research and Analysis (CFRA) performing forensic accounting analysis for short sale opportunities. Mr. Del Vecchio earned a B.S. in Finance, Summa Cum Laude, from Bryant College, and was awarded Beta Gamma Sigma honors. Mr. Del Vecchio earned the right to use the Chartered Financial Analyst designation in September, 2001.
Brad H. Lamensdorf – Portfolio Manager/ Principal
Mr. Lamensdorf serves as a Portfolio Manager for Ranger Alternative Management, L.P. (“Ranger”) and provides trading and market strategy for Ranger’s short only portfolio. Mr. Lamensdorf has served as a Trading and Market Strategist for Ranger since 2009. Mr. Lamensdorf also serves as a principal of Precisian GP, LLC and Portfolio Manager of Precisian Partners L.P., both positions of which he has held since November 2007. Prior to Precisian, Mr. Lamensdorf founded BHL Partners L.P. a commodity oriented hedge fund primarily focused on gold and gold equities. From 1998 through 2005, Mr. Lamensdorf served as principal and portfolio manager for Tarpon Capital Management, L.P., which managed long/short hedge funds. In 1997, he was a founder, partner and co-manager of KBH, L.L.P., an investment firm created to manage investment portfolios for the King-Hughes family. From 1992 through 1996, Mr. Lamensdorf worked on the equity trading desk for the Bass family in Fort Worth, Texas, where he co-managed an extensive equity portfolio with emphasis on short selling and derivatives strategies. He also provided market analysis for fund managers throughout the Bass network. Mr. Lamensdorf received a B.A. in psychology from the University of Texas at Austin in 1992.

HDGE Overview
Get a quick and easy introduction to the HDGE ETF.
HDGE Overview
Get a quick and easy introduction to the HDGE ETF.
Fund
Price History
Fund Data
7/29/2026| NAV | $14.70 |
| Change | $-0.21 |
| Shares Outstanding | 3,972,500 |
| Assets Under Management | $58,411,268.33 |
Market Data
7/29/2026| Closing Price | $14.69 |
| Close Change | $-0.24 |
| Volume | 184,563 |
Regulatory Data
7/29/2026| Premium Discount | $0.01 |
| 30-Day Median bid-ask Spread | 0.000000 |
Shares are bought and sold at market price (closing price) not NAV and are not individually redeemed from the Fund. Market price returns are based on the midpoint of the bid/ask spread at 4:00 pm Eastern Time (when NAV is normally determined), and do not represent the return you would receive if you traded at other times.
FUND
Characteristics
As of 6/30/2026
Source: Morningstar & AdvisorShares
FUND
Performance
As of 6/30/2026
| NAV | Market Price Return | S&P 500 Index | |
|---|---|---|---|
| 1 Month | -0.51 | -0.36 | -0.95 |
| 3 Months | -8.07 | -8.07 | 15.20 |
| YTD | 2.44 | 2.67 | 10.21 |
| 1 Year | 1.25 | 1.10 | 22.32 |
| 3 Years | -3.62 | -3.68 | 20.61 |
| 5 Years | -2.52 | -2.54 | 13.41 |
| 10 Years | -15.24 | -15.26 | 15.51 |
| Since Inception (1/26/2011, Annualized) | -15.02 | -15.03 | 14.14 |
Performance data quoted represents past performance and is no guarantee of future results. All Fund data and performance data quoted is believed to be accurate, and unless otherwise stated, is sourced from the Fund administrator, the Advisor’s or Sub-Advisor’s proprietary data, and Morningstar. Current performance may be lower or higher than the performance data quoted. Investment return and principal value will fluctuate so that an investor’s shares, when redeemed, may be worth more or less than original cost. Returns less than one year are not annualized.
Get Social @AdvisorShares
Join the conversation on social media to hear more from the portfolio manager, get informed about upcoming events and webinars, and more!
| Date | Account Symbol | Stock Ticker | Security ID | Security Description | Shares | Share Price | Market Value | Portfolio Weight | Asset Group |
|---|---|---|---|---|---|---|---|---|---|
| 07/29/2026 | HDGE | CVNA | 146869102 | CARVANA CO | -31,930 | 66.32 | -2,117,597.60 | -3.63% | S |
| PTC | 69370C100 | PTC INC | -14,000 | 132.46 | -1,854,440.00 | -3.17% | S | ||
| CBZ | 124805102 | CBIZ INC | -30,000 | 54.90 | -1,647,000.00 | -2.82% | S | ||
| EXPO | 30214U102 | EXPONENT INC | -25,000 | 65.85 | -1,646,125.00 | -2.82% | S | ||
| WAL | 957638109 | WESTERN ALLIANCE BANCORP | -20,000 | 80.70 | -1,614,000.00 | -2.76% | S | ||
| CVSA | 00737L103 | COVISTA INC | -12,000 | 133.60 | -1,603,200.00 | -2.74% | S | ||
| LOPE | 38526M106 | GRAND CANYON EDUCATION INC | -10,000 | 159.31 | -1,593,100.00 | -2.73% | S | ||
| NXST | 65336K103 | NEXSTAR MEDIA GROUP INC | -8,000 | 196.94 | -1,575,520.00 | -2.70% | S | ||
| SIG | G81276100 | SIGNET JEWELERS LTD | -15,000 | 98.86 | -1,482,900.00 | -2.54% | FS | ||
| DKNG | 26142V105 | DRAFTKINGS INC-CL A | -60,000 | 24.55 | -1,473,000.00 | -2.52% | S | ||
| PAY | 70439P108 | PAYMENTUS HOLDINGS INC-A | -40,000 | 36.70 | -1,468,000.00 | -2.51% | S | ||
| GLBE | M5216V106 | GLOBAL-E ONLINE LTD | -35,000 | 40.26 | -1,409,100.00 | -2.41% | FS | ||
| BAH | 099502106 | BOOZ ALLEN HAMILTON HOLDINGS | -20,000 | 70.17 | -1,403,400.00 | -2.40% | S | ||
| FICO | 303250104 | FAIR ISAAC CORP | -1,000 | 1,373.08 | -1,373,080.00 | -2.35% | S | ||
| OZK | 06417N103 | BANK OZK | -25,000 | 51.55 | -1,288,750.00 | -2.21% | S | ||
| VRSK | 92345Y106 | VERISK ANALYTICS INC | -6,000 | 213.15 | -1,278,900.00 | -2.19% | S | ||
| INTA | 45827U109 | INTAPP INC | -40,000 | 31.67 | -1,266,800.00 | -2.17% | S | ||
| AZO | 053332102 | AUTOZONE INC | -400 | 3,142.17 | -1,256,868.00 | -2.15% | S | ||
| TRU | 89400J107 | TRANSUNION | -15,000 | 83.73 | -1,255,950.00 | -2.15% | S | ||
| ABG | 043436104 | ASBURY AUTOMOTIVE GROUP | -5,000 | 248.26 | -1,241,300.00 | -2.13% | S | ||
| PAYX | 704326107 | PAYCHEX INC | -10,000 | 122.13 | -1,221,300.00 | -2.09% | S | ||
| QTWO | 74736L109 | Q2 HOLDINGS INC | -20,000 | 60.42 | -1,208,400.00 | -2.07% | S | ||
| AMH | 02665T306 | AMERICAN HOMES 4 RENT- A | -35,000 | 33.71 | -1,179,850.00 | -2.02% | S | ||
| DDS | 254067101 | DILLARDS INC-CL A | -2,000 | 589.15 | -1,178,300.00 | -2.02% | S | ||
| PUK | 74435K204 | PRUDENTIAL PLC-ADR | -40,000 | 29.25 | -1,170,000.00 | -2.00% | FS | ||
| CTSH | 192446102 | COGNIZANT TECH SOLUTIONS-A | -20,000 | 55.97 | -1,119,400.00 | -1.92% | S | ||
| ALRM | 011642105 | ALARM.COM HOLDINGS INC | -20,000 | 55.69 | -1,113,800.00 | -1.91% | S | ||
| WPP | 92937A102 | WPP PLC-SPONSORED ADR | -50,000 | 21.63 | -1,081,500.00 | -1.85% | FS | ||
| TRI | 884903881 | THOMSON REUTERS CORP | -10,000 | 106.34 | -1,063,400.00 | -1.82% | FS | ||
| MANH | 562750109 | MANHATTAN ASSOCIATES INC | -5,000 | 204.02 | -1,020,100.00 | -1.75% | S | ||
| ARES | 03990B101 | ARES MANAGEMENT CORP - A | -8,000 | 124.60 | -996,800.00 | -1.71% | S | ||
| BBWI | 070830104 | BATH & BODY WORKS INC | -50,000 | 19.70 | -985,000.00 | -1.69% | S | ||
| KVYO | 49845K101 | KLAVIYO INC-A | -50,000 | 19.37 | -968,500.00 | -1.66% | S | ||
| RDNT | 750491102 | RADNET INC | -15,000 | 63.37 | -950,550.00 | -1.63% | S | ||
| OMF | 68268W103 | ONEMAIN HOLDINGS INC | -15,000 | 62.94 | -944,100.00 | -1.62% | S | ||
| CRM | 79466L302 | SALESFORCE INC | -5,000 | 188.38 | -941,900.00 | -1.61% | S | ||
| WK | 98139A105 | WORKIVA INC | -15,000 | 61.45 | -921,750.00 | -1.58% | S | ||
| ORLY | 67103H107 | O'REILLY AUTOMOTIVE INC | -10,000 | 90.63 | -906,300.00 | -1.55% | S | ||
| INVH | 46187W107 | INVITATION HOMES INC | -30,000 | 30.11 | -903,300.00 | -1.55% | S | ||
| DEO | 25243Q205 | DIAGEO PLC-SPONSORED ADR | -10,000 | 89.16 | -891,600.00 | -1.53% | FS | ||
| MMYT | V5633W109 | MAKEMYTRIP LTD | -15,000 | 57.15 | -857,250.00 | -1.47% | FS | ||
| WFC | 949746101 | WELLS FARGO & CO | -10,000 | 83.87 | -838,700.00 | -1.44% | S | ||
| PLTR | 69608A108 | PALANTIR TECHNOLOGIES INC-A | -6,666 | 123.00 | -819,918.00 | -1.40% | S | ||
| ELF | 26856L103 | ELF BEAUTY INC | -10,000 | 80.90 | -809,000.00 | -1.38% | S | ||
| DASH | 25809K105 | DOORDASH INC - A | -4,000 | 193.53 | -774,120.00 | -1.33% | S | ||
| ONON | H5919C104 | ON HOLDING AG-CLASS A | -20,000 | 37.91 | -758,200.00 | -1.30% | FS | ||
| BOOT | 099406100 | BOOT BARN HOLDINGS INC | -5,000 | 150.89 | -754,450.00 | -1.29% | S | ||
| PCOR | 74275K108 | PROCORE TECHNOLOGIES INC | -15,000 | 50.16 | -752,400.00 | -1.29% | S | ||
| SYF | 87165B103 | SYNCHRONY FINANCIAL | -10,000 | 74.97 | -749,700.00 | -1.28% | S | ||
| BLDR | 12008R107 | BUILDERS FIRSTSOURCE INC | -10,000 | 67.76 | -677,600.00 | -1.16% | S | ||
| MNRO | 610236101 | MONRO INC | -50,000 | 13.26 | -662,750.00 | -1.13% | S | ||
| APP | 03831W108 | APPLOVIN CORP-CLASS A | -1,386 | 399.46 | -553,651.56 | -0.95% | S | ||
| X9USDBLFD | BLACKROCK FEDERAL FD 30 INSTL | 522,045.96 | 1.00 | 522,045.96 | 0.89% | MM | |||
| LNADRBCTL | DERIVATIVES COLLATERAL CF SECURED | 34,622,666.33 | 1.00 | 34,622,666.33 | 59.27% | MM | |||
| X9USDFITY | FIDELITY INSTL GOVT 657 C | 39,404,436.18 | 1.00 | 39,404,436.18 | 67.46% | MM | |||
| CASH | 43,485,506.48 | 100.00 | 43,485,506.48 | 74.45% | CA |
FUND
Annual Fund Operating Expenses (expenses that you pay each year as a percentage of the value of your investment)
| Management Fee | 1.50% | ||
| Other Expenses | 1.83% | ||
| Short Interest Expenses | 1.55% | ||
| Remaining Expenses | 0.28% | ||
| Acquired Fund Fees and Expenses* | 0.29% | ||
| Net Expense Ratio | 3.62% |
| Expense Cap Limitation* | 1.85% |
*Total Annual Operating Expenses in this fee table may not correlate to the expense ratios in the Fund’s financial highlights because the financial highlights include only the Fund’s direct operating expenses. The Advisor has contractually agreed to limit the Fund’s total annual operating expenses to 1.85% of average daily net assets. Because the Fund’s current net expense ratio is below the contractual cap, this limitation is not presently in effect. The net expense ratio shown includes Acquired Fund Fees and Expenses, which are not direct costs borne by shareholders. For more information, please read the full prospectus.
Last Ten
Fund Distributions
")
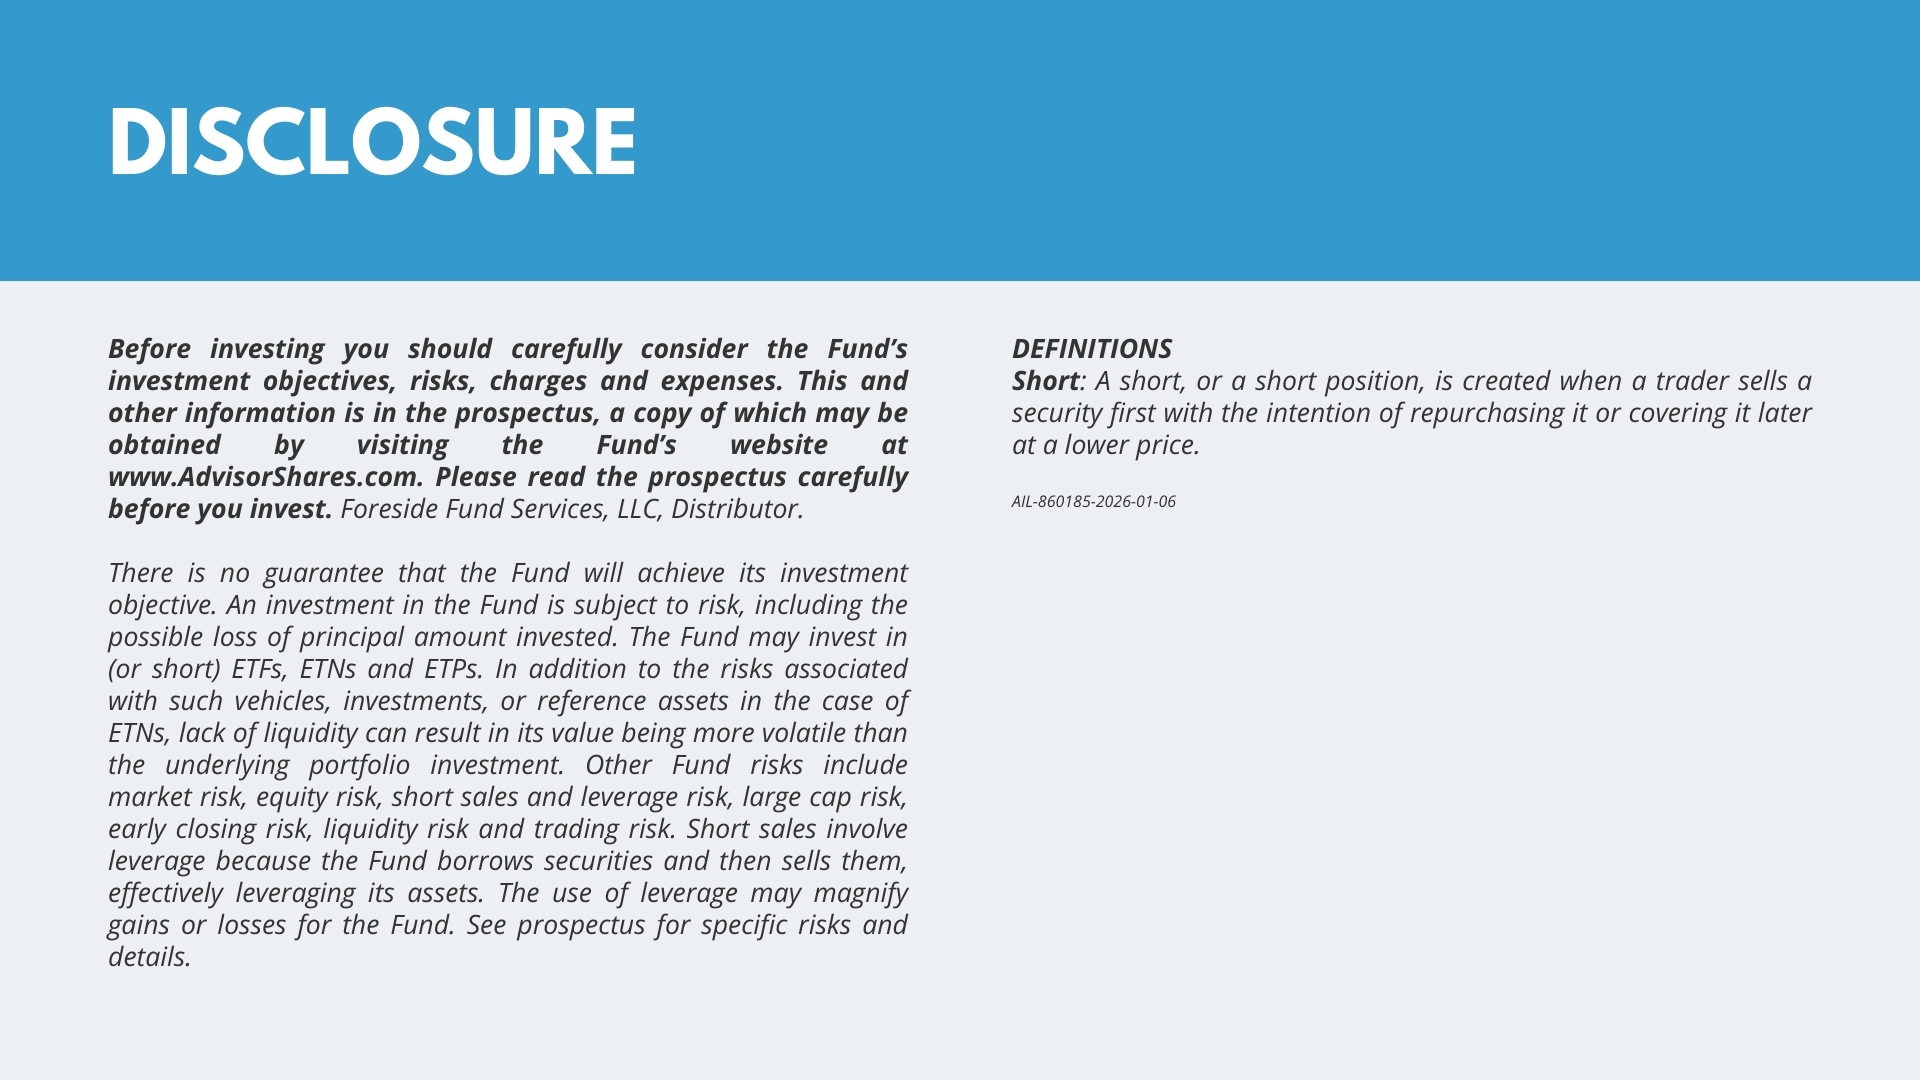
- Before investing you should carefully consider the Fund’s investment objectives, risks, charges and expenses. This and other information is in the prospectus, a copy of which may be obtained by visiting the Fund’s website at www.AdvisorShares.com. Please read the prospectus carefully before you invest. Foreside Fund Services, LLC, Distributor.
- There is no guarantee that the Fund will achieve its investment objective. An investment in the Fund is subject to risk, including the possible loss of principal amount invested. The Fund may invest in (or short) ETFs, ETNs and ETPs. In addition to the risks associated with such vehicles, investments, or reference assets in the case of ETNs, lack of liquidity can result in its value being more volatile than the underlying portfolio investment. Other Fund risks include market risk, equity risk, short sales and leverage risk, large cap risk, early closing risk, liquidity risk and trading risk. Short sales involve leverage because the Fund borrows securities and then sells them, effectively leveraging its assets. The use of leverage may magnify gains or losses for the Fund. See prospectus for specific risks and details.
- Definitions
- Short: A short, or a short position, is created when a trader sells a security first with the intention of repurchasing it or covering it later at a lower price.
ETF
Social
Conversation