
NAV as of 7/31/2026
$49.65
1 Day NAV Change as of 7/31/2026
$-0.25
| Symbol | Exchange | Inception Date | CUSIP | NAV | Indicative Value | Options Available |
|---|---|---|---|---|---|---|
| DWAW | Nasdaq | 12/26/2019 | 00768Y479 | DWAW.NAV | DWAW.IV | Yes |
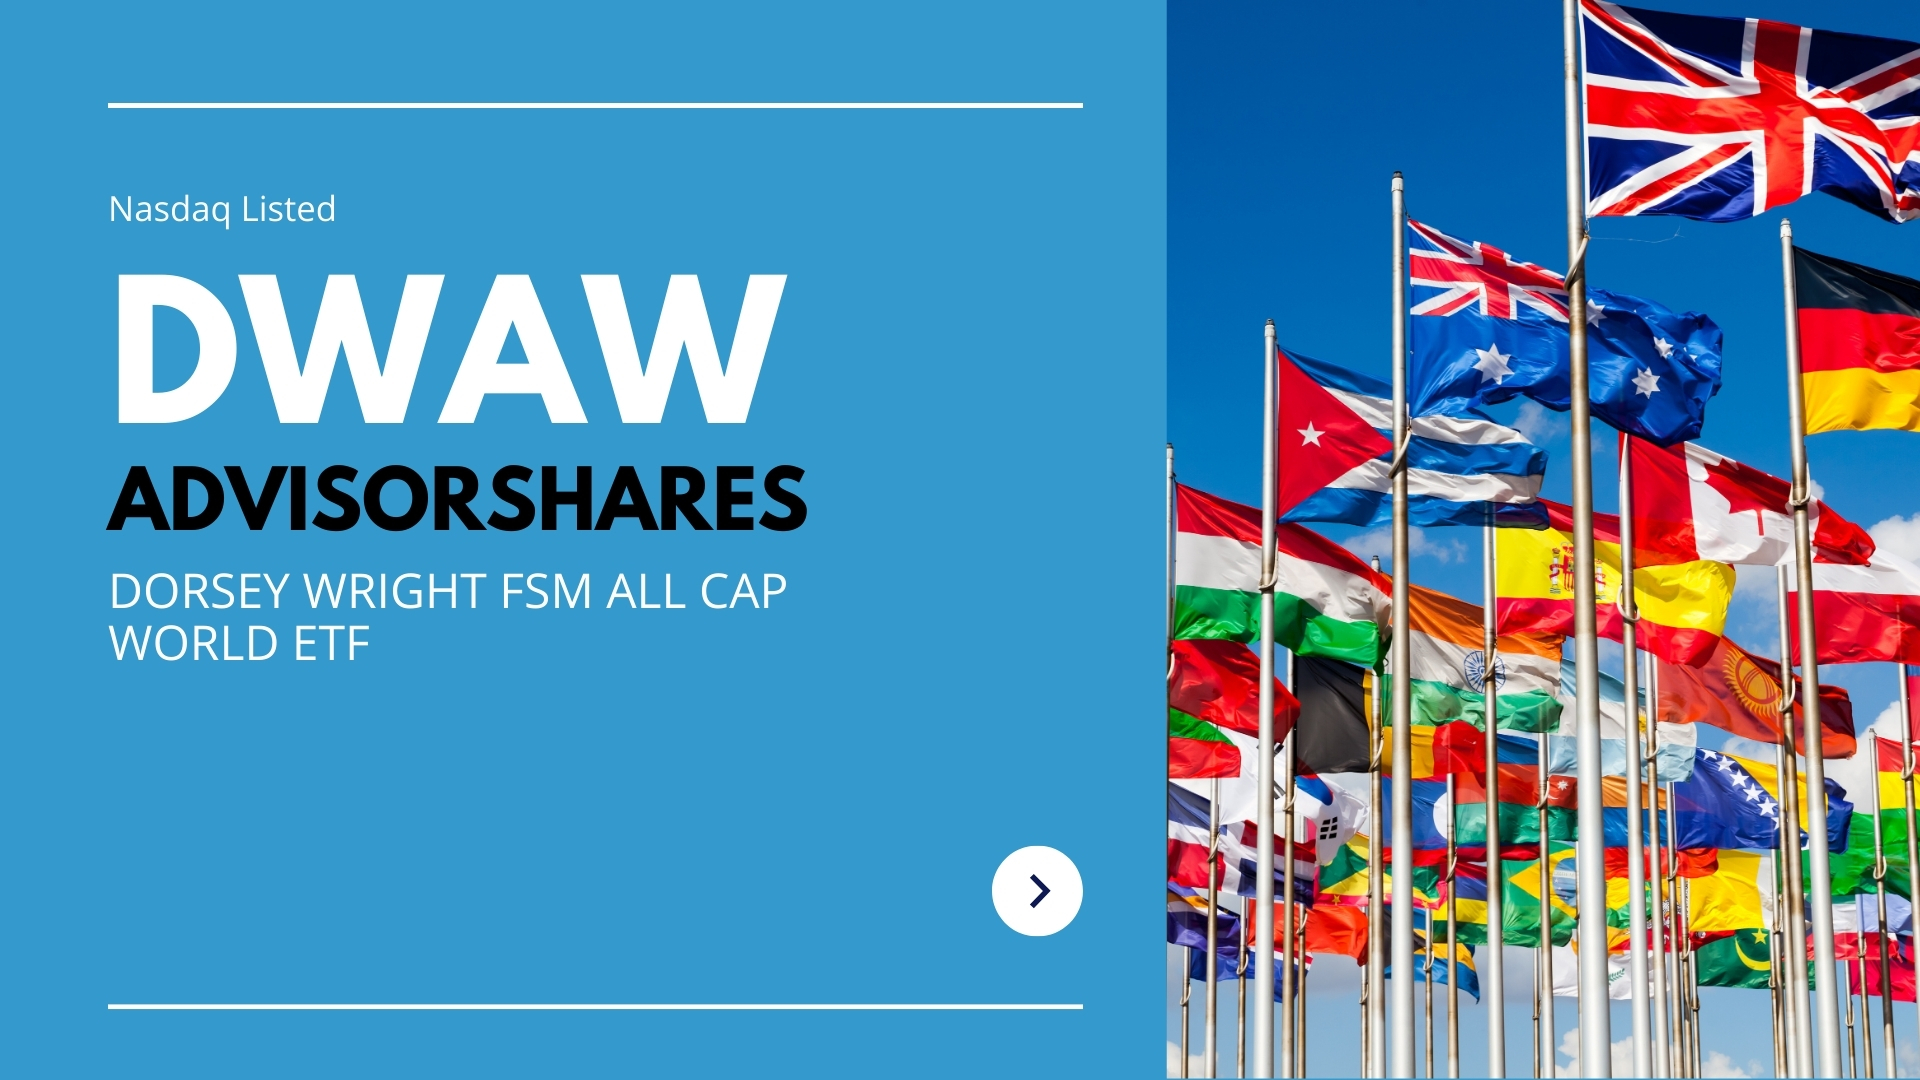
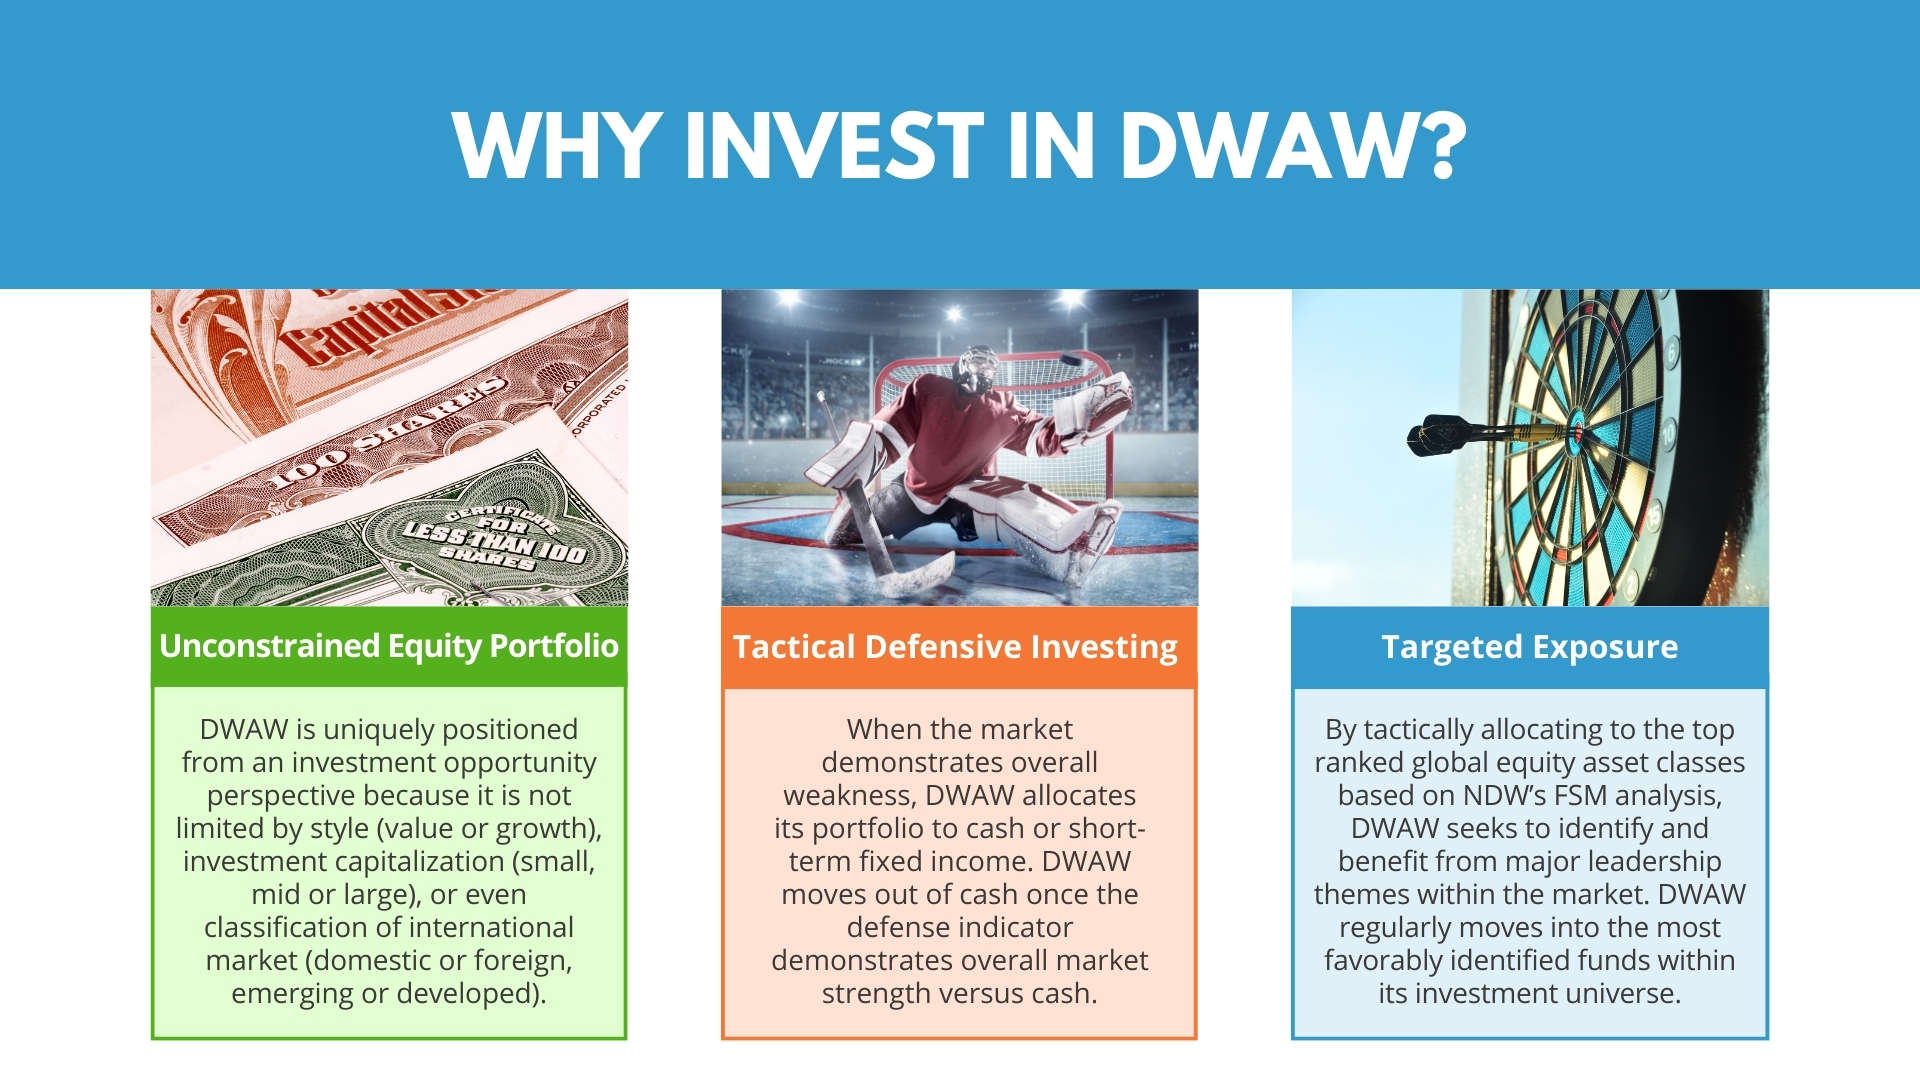
Why Invest in DWAW?
- Alpha-Seeking Complement to Broad Based Exposure – Broad based indexes, by their nature, have the good and the bad, the strong and the weak. DWAW seeks to add alpha using Dorsey Wright’s historically successful trend following process and investment modeling that looks to identify the strongest asset classes from the weaker performers.
- Active Management Advantage – Many ETFs passively invest owning the majority of the stocks represented in their benchmark index, including those with less than attractive investing attributes. DWAW’s investment process systematically screens a broad variety of asset classes in the FSM All Cap World investment universe for inclusion or removal from its highly tactical, active portfolio.
- Asset Class Rotation – Owning or even avoiding certain asset classes – domestic or foreign, small or large cap, growth or value, factor or market based – is an important determinant of portfolio success. Asset classes rotate in and out of season. Sometimes those trends last for years, other times for months. By investing in the highest FSM ranked funds, DWAW seeks to capture the growth of those asset classes demonstrating the greatest relative strength while avoiding the weakest.
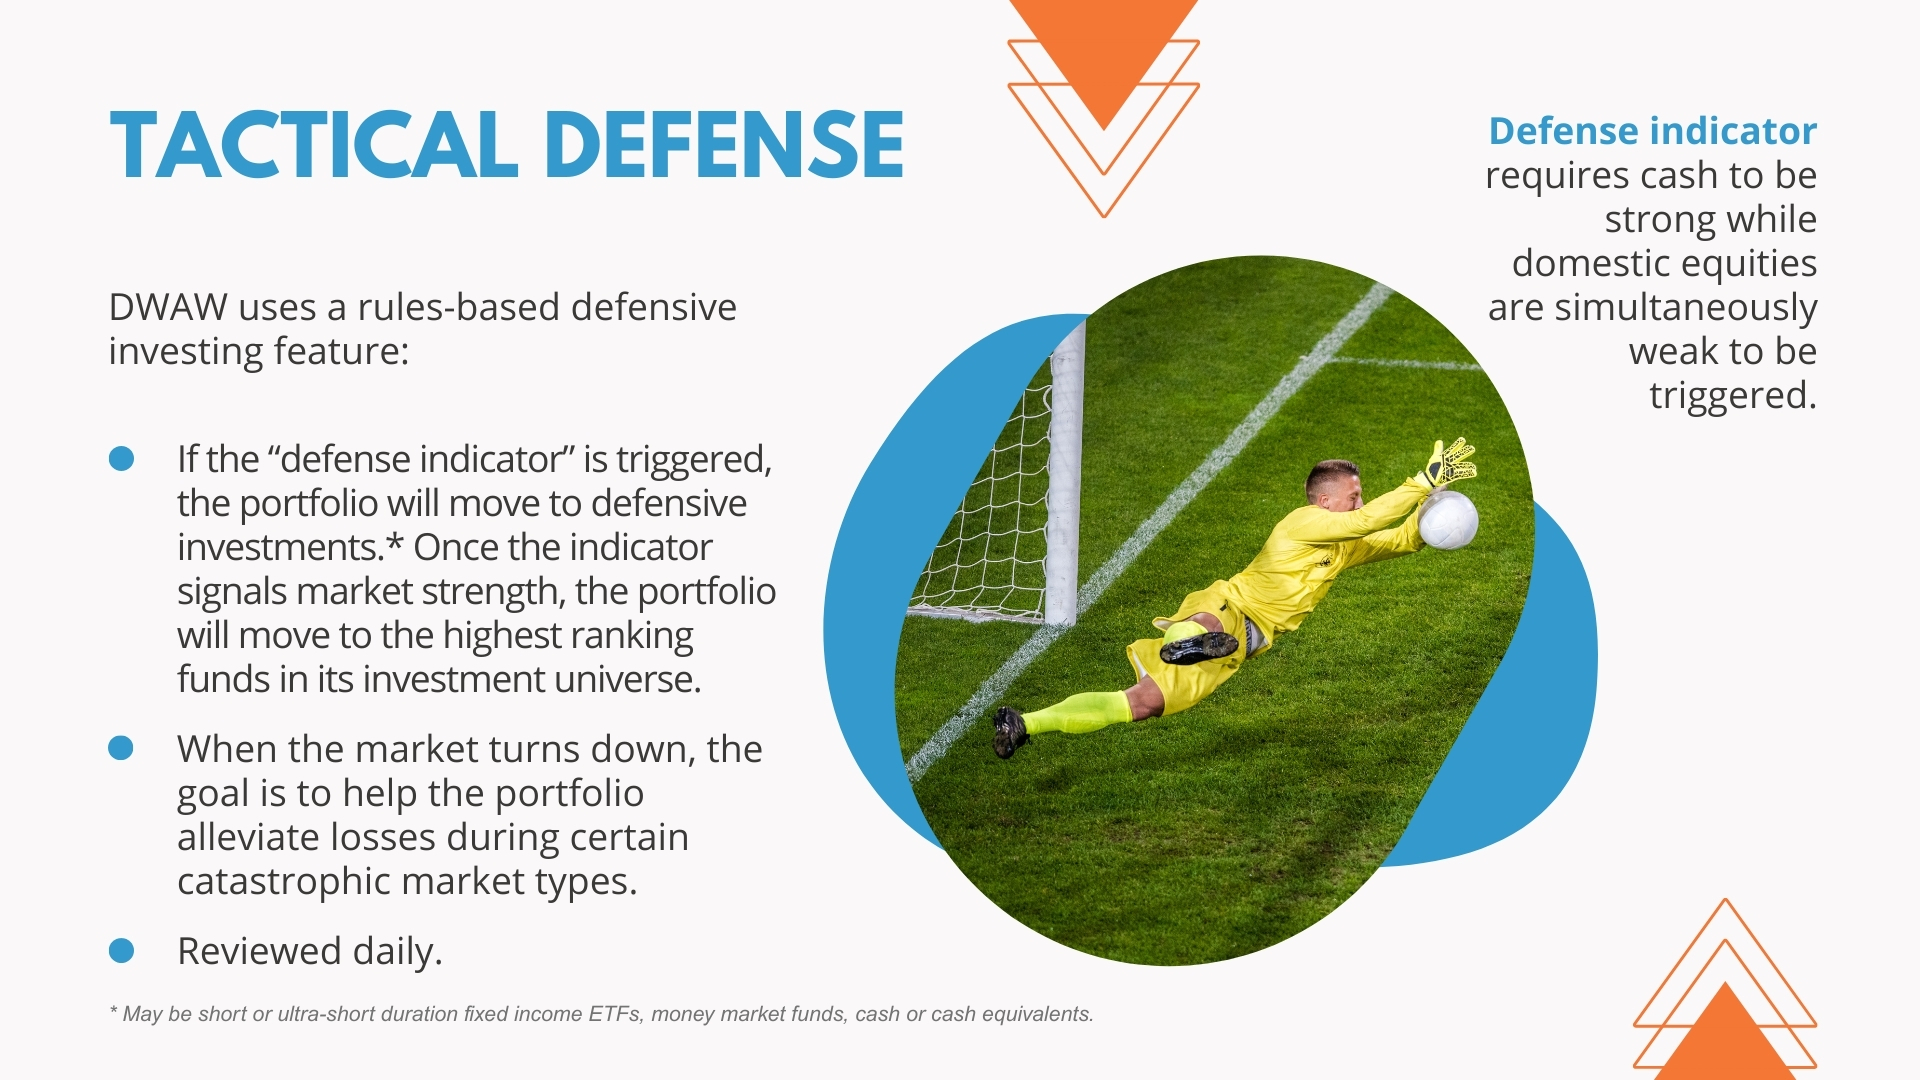
- Systematic Defense – Because we believe avoiding severe losses helps to preserve capital and can contribute to good performance over time, DWAW uses a rules-based approach to tactically add cash or short term fixed income exposure to the portfolio when momentum indicators are triggered. The temporary defensive position is to try to shield the portfolio from certain catastrophic market types.
Where Can DWAW Fit in a Traditional Portfolio?
DWAW can serve as an alpha-seeking complement to a broad-based market cap weighted position, such as a fund that tracks a global index, as well as a stand-alone investment solution for world equity exposure with tactical asset allocation.
Key Attributes
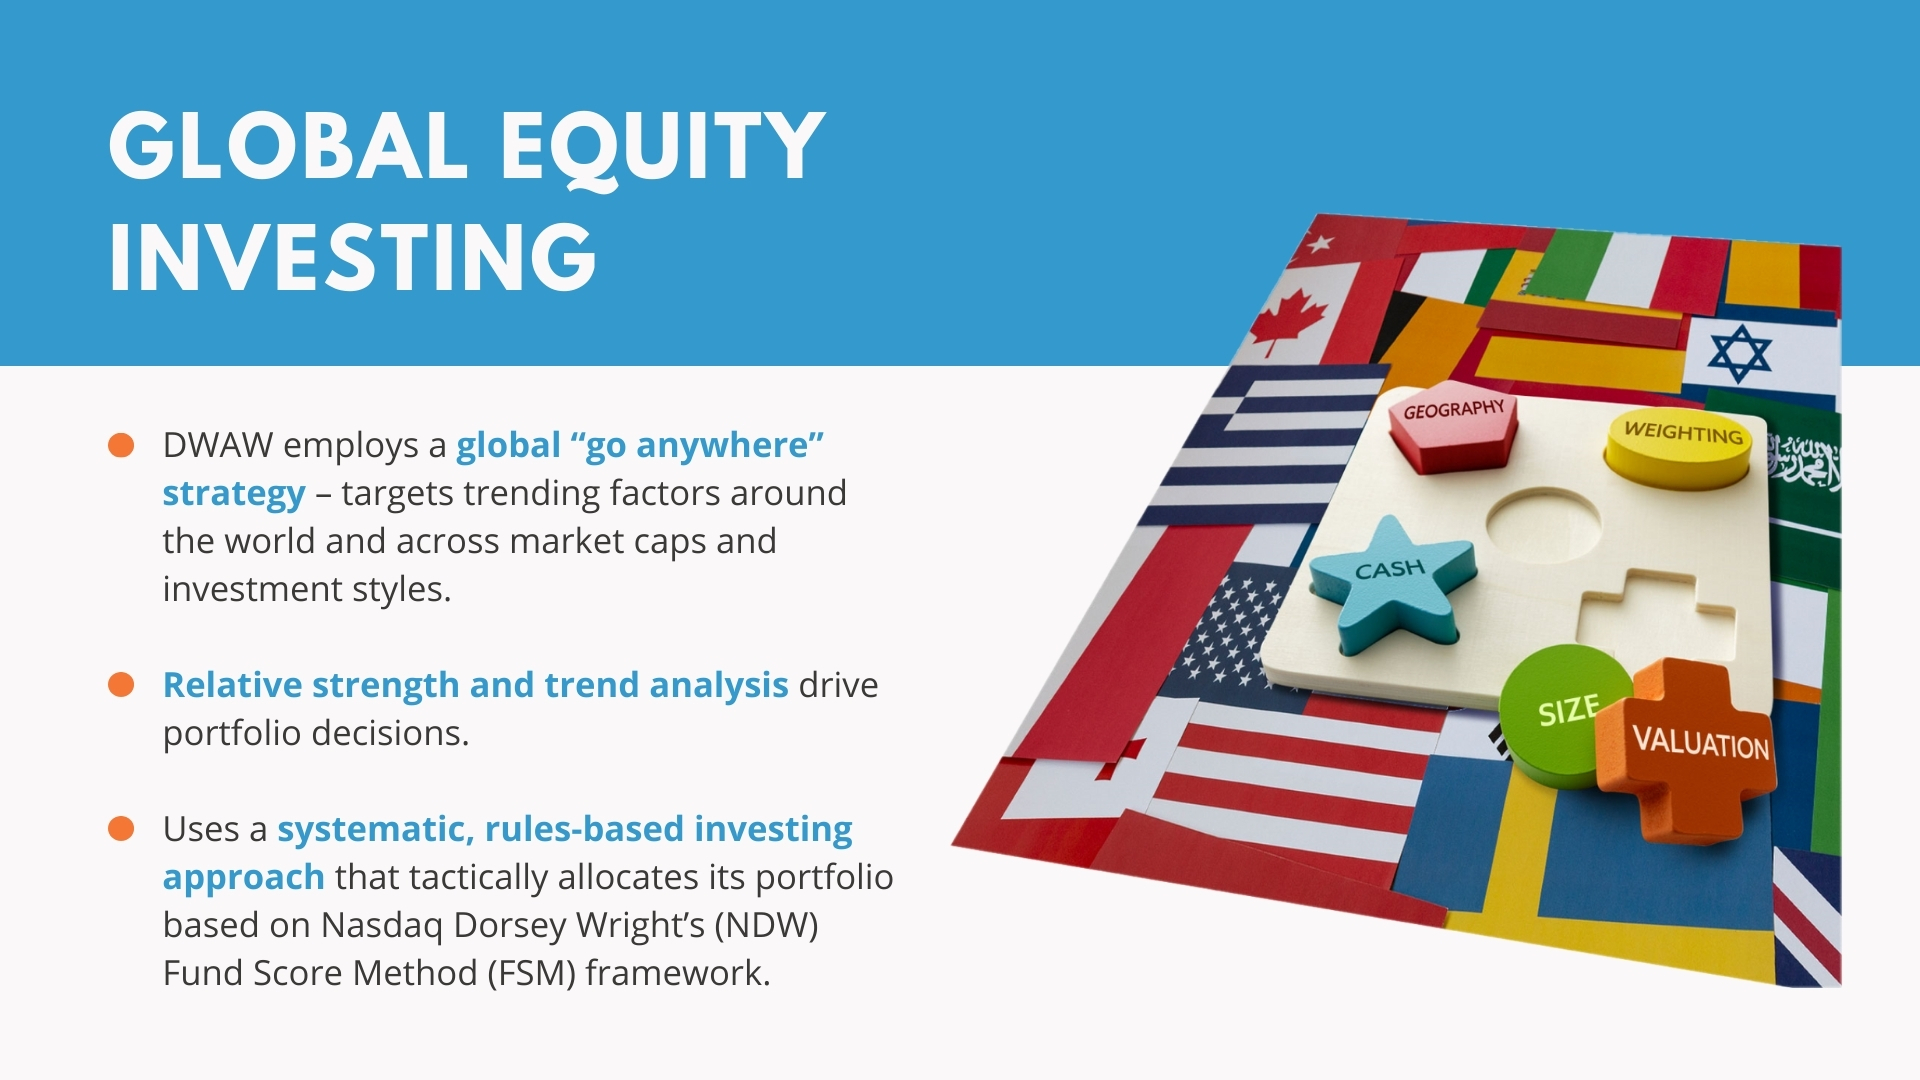
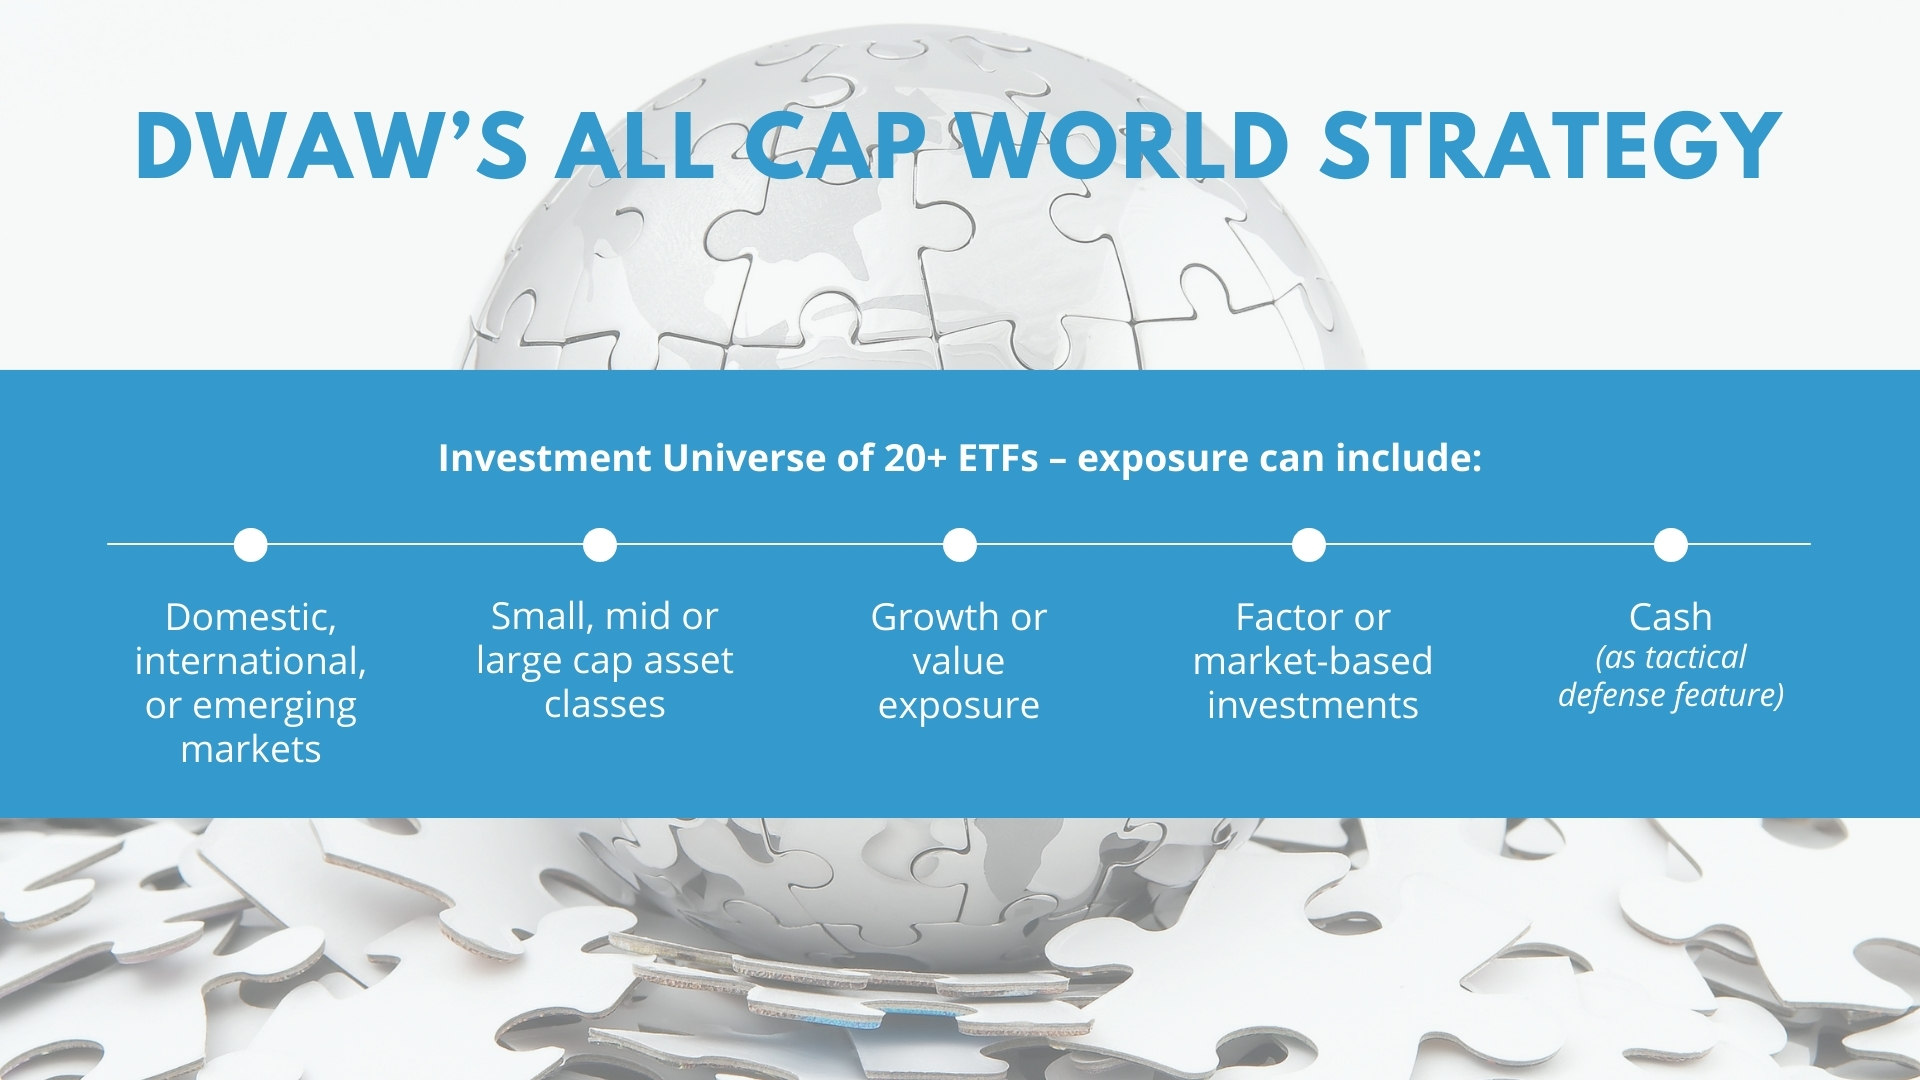
- Unconstrained Equity Portfolio – DWAW is uniquely positioned from an investment opportunity perspective because it is not limited by style (value or growth), investment capitalization (small, mid or large), or even classification of international markets (domestic or foreign, emerging or developed).
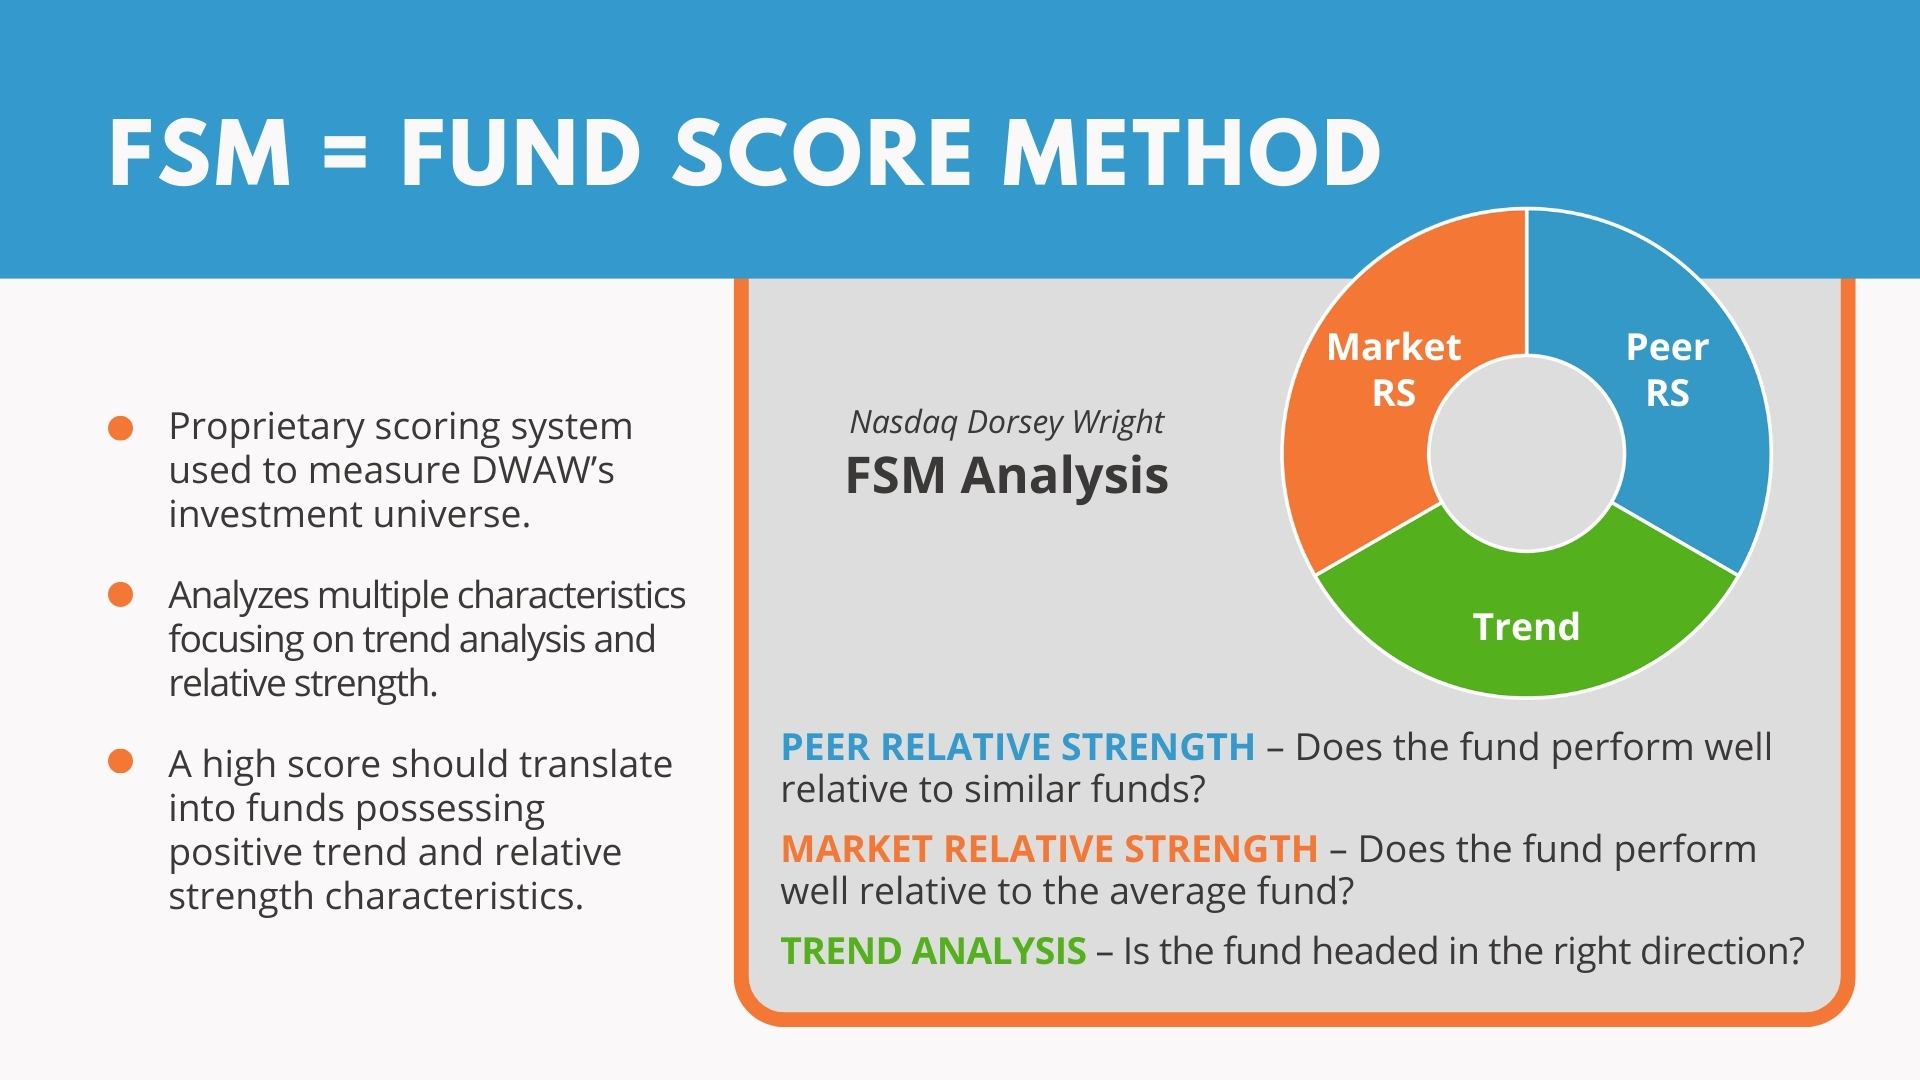
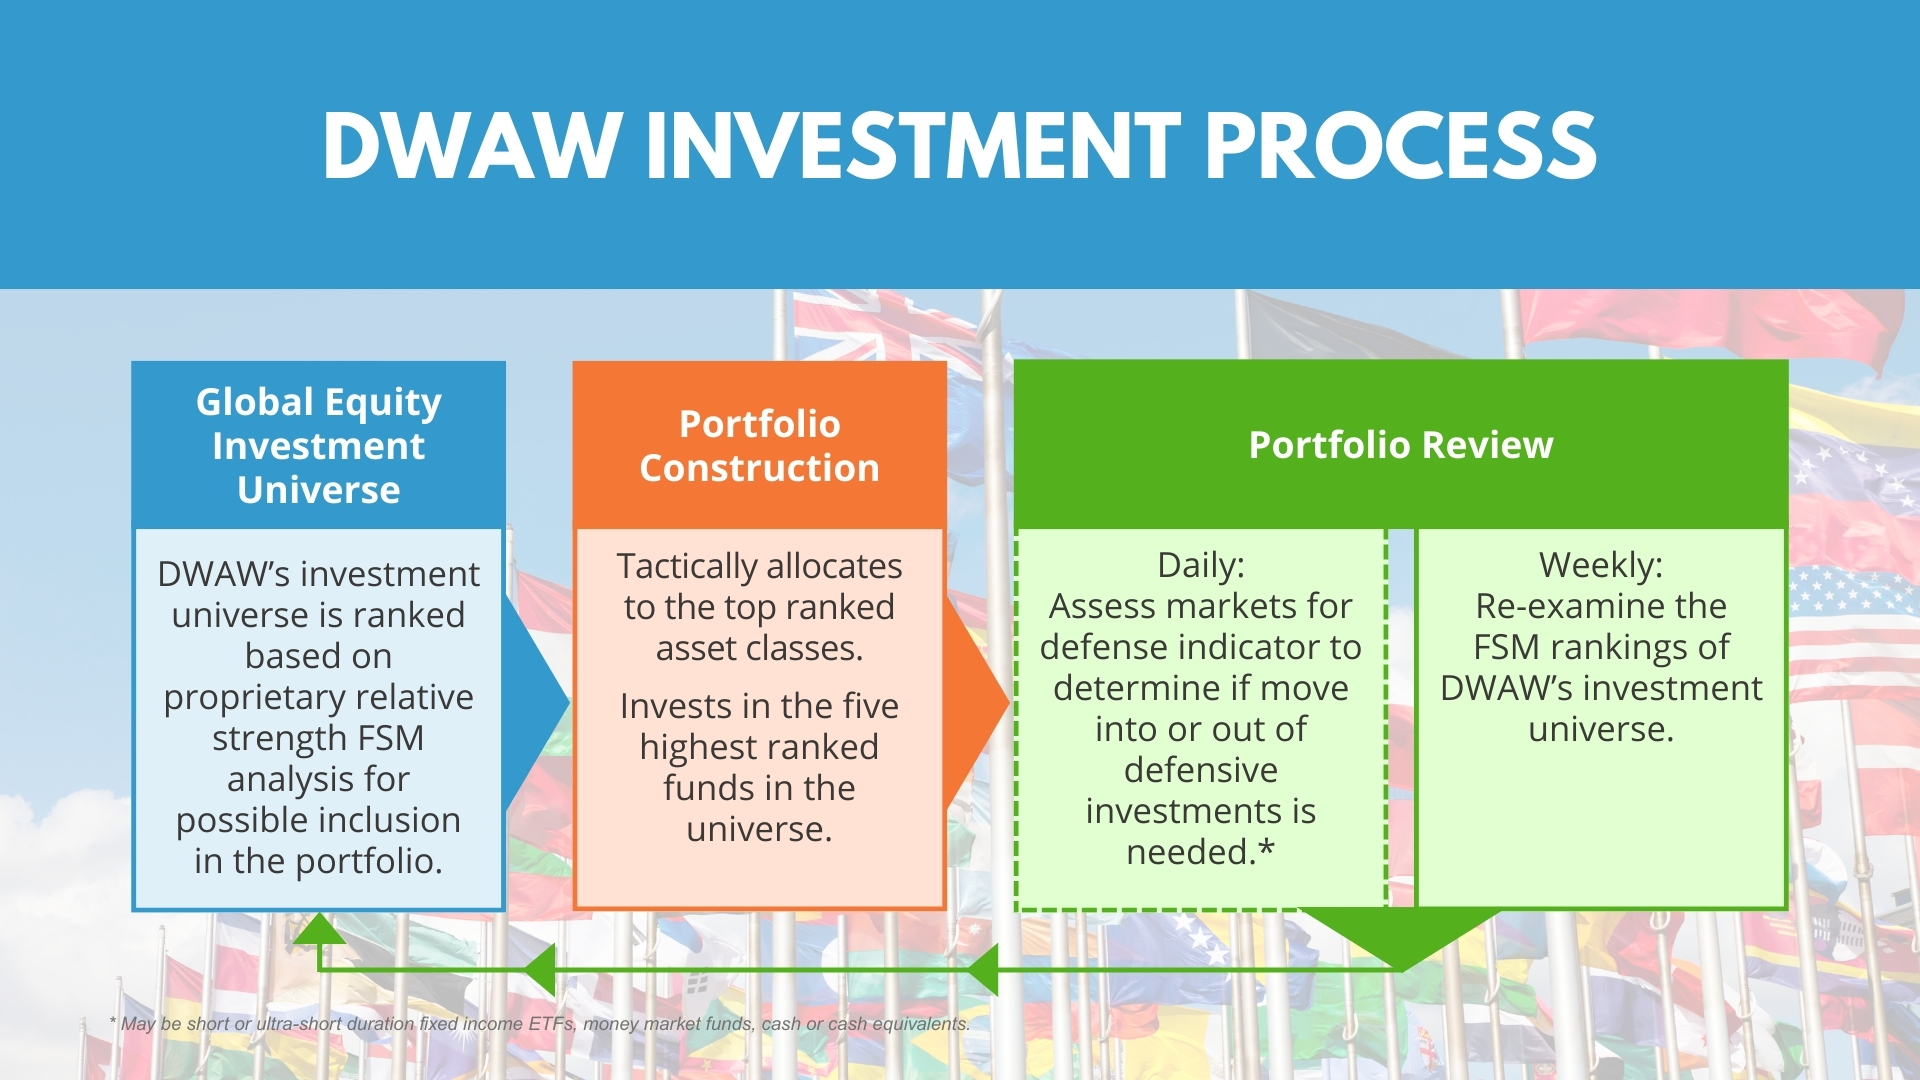
- Targeted Asset Class Exposure – By tactically allocating to the top ranked asset classes based on Dorsey Wright’s FSM ranking and modeling DWAW seeks to identify and benefit from major leadership themes within the market.. The Fund Score Method (FSM) framework is designed to provide an objective, rules-based approach that has the ability to rotate between a lineup of ETFs using the Nasdaq Dorsey Wright fund score system. Every ETF on the Nasdaq Dorsey Wright research platform has a fund score ranging from 0 (weak) to 6 (strong). These scores are derived using three main areas of evaluation: trend analysis, market relative strength, and peer relative strength. DWAW will regularly rebalance on an equal weight basis into the most favorably identified funds within the FSM All Cap World investment universe.
- Relative Strength Analysis– DWAW uses a relative strength strategy, via FSM rankings, which compares price performance within a universe of stocks and is designed to remove human emotion from the decision process. This is a disciplined, repeatable process to systematically identify and select which sectors and stocks to own, as well as, which to avoid or sell.
- Tactical Defensive Investing – When the market demonstrates overall weakness, DWAW will gradually allocate to cash or short term fixed income. This cash allocation will incrementally increase or decrease based on whether the momentum indicator is showing overall market strength or weakness versus cash.
About the Portfolio Manager
Nasdaq Dorsey Wright, Model Manager
Nasdaq Dorsey Wright is a registered investment advisory firm based in Richmond, Virginia. Since 1987, Dorsey Wright has offered comprehensive investment research and analysis through their Global Technical Research Platform. Dorsey Wright’s expertise is technical analysis, utilizing Point & Figure Charting, Relative Strength Analysis, and numerous other technical and systematic tools to analyze market data and deliver actionable insights.
Dan Ahrens, Managing Director, Chief Operating Officer, Chief Investment Officer, & Portfolio Manager
Dan S. Ahrens is a Managing Director, Chief Operating Officer and the Chief Investment Officer of the Advisor. He joined the Advisor in 2008. Prior to joining the Advisor in 2008, Mr. Ahrens founded Ahrens Advisors, L.P., an SEC-registered investment adviser, where he was portfolio manager of the Ladenburg Thalmann Gaming and Casino Fund from 2006 to 2008. Before forming Ahrens Advisors, he was President of the MUTUALS.com Funds. He served as portfolio manager of the Vice Fund (VICEX), which he started in 2002, and the Generation Wave Growth Fund. During that time, he also was President and Chief Compliance Officer of Mutuals Advisors, Inc. and acted as President, Treasurer and Financial & Operations Officer of an affiliated broker dealer firm. He is the author of Investing in Vice (St. Martin’s Press, 2004) and Investing in Cannabis (Wiley, 2020) and has appeared on numerous financial programs, including CNBC, CNN, ABC News and Bloomberg. He has been featured, along with funds under his management, in major national and trade publications including The Economist, New York Times, Financial Times, and The Wall Street Journal. He earned a Bachelor in Business Administration in Finance from Texas Tech University.
Fund
Price History
Fund Data
7/31/2026| NAV | $49.65 |
| Change | $-0.25 |
| Shares Outstanding | 1,835,000 |
| Assets Under Management | $91,100,576.70 |
Market Data
7/31/2026| Closing Price | $49.64 |
| Close Change | $-0.26 |
| Volume | 231 |
Regulatory Data
7/31/2026| Premium Discount | $-0.02 |
| 30-Day Median bid-ask Spread | 0.002207 |
Shares are bought and sold at market price (closing price) not NAV and are not individually redeemed from the Fund. Market price returns are based on the midpoint of the bid/ask spread at 4:00 pm Eastern Time (when NAV is normally determined), and do not represent the return you would receive if you traded at other times.
")
FUND
Characteristics
As of 6/30/2026
Source: Morningstar & AdvisorShares
Get Social @AdvisorShares
Join the conversation on social media to hear more from the portfolio manager, get informed about upcoming events and webinars, and more!
| Date | Account Symbol | Stock Ticker | Security ID | Security Description | Shares | Share Price | Market Value | Portfolio Weight | Asset Group |
|---|---|---|---|---|---|---|---|---|---|
| 07/31/2026 | DWAW | IVLU | 46435G409 | ISHARES MSCI INTERNATIONAL V | 423,699 | 43.53 | 18,443,617.47 | 20.25% | MF |
| QUAL | 46432F339 | ISHARES MSCI USA QUALITY FAC | 83,344 | 219.32 | 18,279,006.08 | 20.07% | MF | ||
| IWO | 464287648 | ISHARES RUSSELL 2000 GROWTH | 49,000 | 370.67 | 18,162,830.00 | 19.94% | MF | ||
| VLUE | 46432F388 | ISHARES MSCI USA VALUE FACTO | 95,013 | 191.14 | 18,160,784.82 | 19.94% | MF | ||
| IWN | 464287630 | ISHARES RUSSELL 2000 VALUE E | 81,000 | 221.24 | 17,920,440.00 | 19.67% | MF | ||
| X9USDBLYT | BLACKROCK TREASURY TRUST INSTL 62 | 16,585,588.82 | 1.00 | 16,585,588.82 | 18.21% | MM | |||
| CASH | -16,456,178.74 | 100.00 | -16,456,178.74 | -18.06% | CA |
FUND
Performance
As of 6/30/2026
| NAV | Market Price Return | MSCI All Country World Index (ACWI) | |
|---|---|---|---|
| 1 Month | 0.69 | 0.69 | -0.80 |
| 3 Months | 19.08 | 19.05 | 14.93 |
| YTD | 15.77 | 15.79 | 11.25 |
| 1 Year | 23.82 | 23.94 | 23.67 |
| 3 Years | 18.37 | 18.35 | 19.70 |
| 5 Years | 7.83 | 7.82 | 10.98 |
| Since Inception (12/26/2019, Annualized) | 12.31 | 12.31 | 12.86 |
Performance data quoted represents past performance and is no guarantee of future results. All Fund data and performance data quoted is believed to be accurate, and unless otherwise stated, is sourced from the Fund administrator, the Advisor’s or Sub-Advisor’s proprietary data, and Morningstar. Current performance may be lower or higher than the performance data quoted. Investment return and principal value will fluctuate so that an investor’s shares, when redeemed, may be worth more or less than original cost. Returns less than one year are not annualized.
FUND
Fees & Expenses
Annual Fund Operating Expenses (expenses that you pay each year as a percentage of the value of your investment)
| Management Fee | 0.75% | |
| Other Expenses | 0.20% | |
| Acquired Fund Fees and Expenses* | 0.28% | |
| Net Expense Ratio | 1.23% |
| Expense Cap Limitation* | 0.99% |
*Total Annual Operating Expenses in this fee table may not correlate to the expense ratio in the Fund’s financial highlights because the financial highlights include only the Fund’s direct operating expenses and do not include Acquired Fund Fees and Expenses, which represent the Fund’s pro rata share of the fees and expenses of exchange-traded funds and/or money market funds in which it invests. The Advisor has contractually agreed to limit the Fund’s total annual operating expenses to 0.99% of average daily net assets. Because the Fund’s current net expense ratio is below the contractual cap, this limitation is not presently in effect. The net expense ratio shown includes Acquired Fund Fees and Expenses, which are not direct costs borne by shareholders. For more information, please read the full prospectus.
Last Ten
Fund Distributions
-
Before investing you should carefully consider the Fund’s investment objectives, risks, charges and expenses. This and other information is in the prospectus, a copy of which may be obtained by visiting the Fund’s website at www.AdvisorShares.com. Please read the prospectus carefully before you invest. Foreside Fund Services, LLC, Distributor.
-
An investment in the Fund is subject to risk, including the possible loss of principal amount invested. There is no guarantee that the Fund will achieve its investment objective.
The Advisor’s judgment about the markets, the economy, or companies may not anticipate actual market movements, economic conditions or company performance, and these factors may affect the return on your investment. Foreign investing involves special risks, such as risk of loss from currency fluctuation or political or economic uncertainty. Investments in emerging or offshore markets are generally less liquid and less efficient than investments in developed markets and are subject to additional risks, such as risks of adverse governmental regulation and intervention or political developments. The market value of debt securities held by the Fund typically changes as interest rates change, as demand for the instruments changes, and as actual or perceived creditworthiness of an issuer changes.
Definitions:
-
Alpha: One of the most commonly quoted indicators of investment performance, alpha, is defined as the excess return on an investment relative to the return on a benchmark index.
-
ETF
Social
Conversation