
| Symbol | Exchange | Inception Date | CUSIP | NAV | Options Available |
|---|---|---|---|---|---|
| EATZ | NYSE Arca | 4/20/2021 | 00768Y388 | EATZ.NV | Yes |
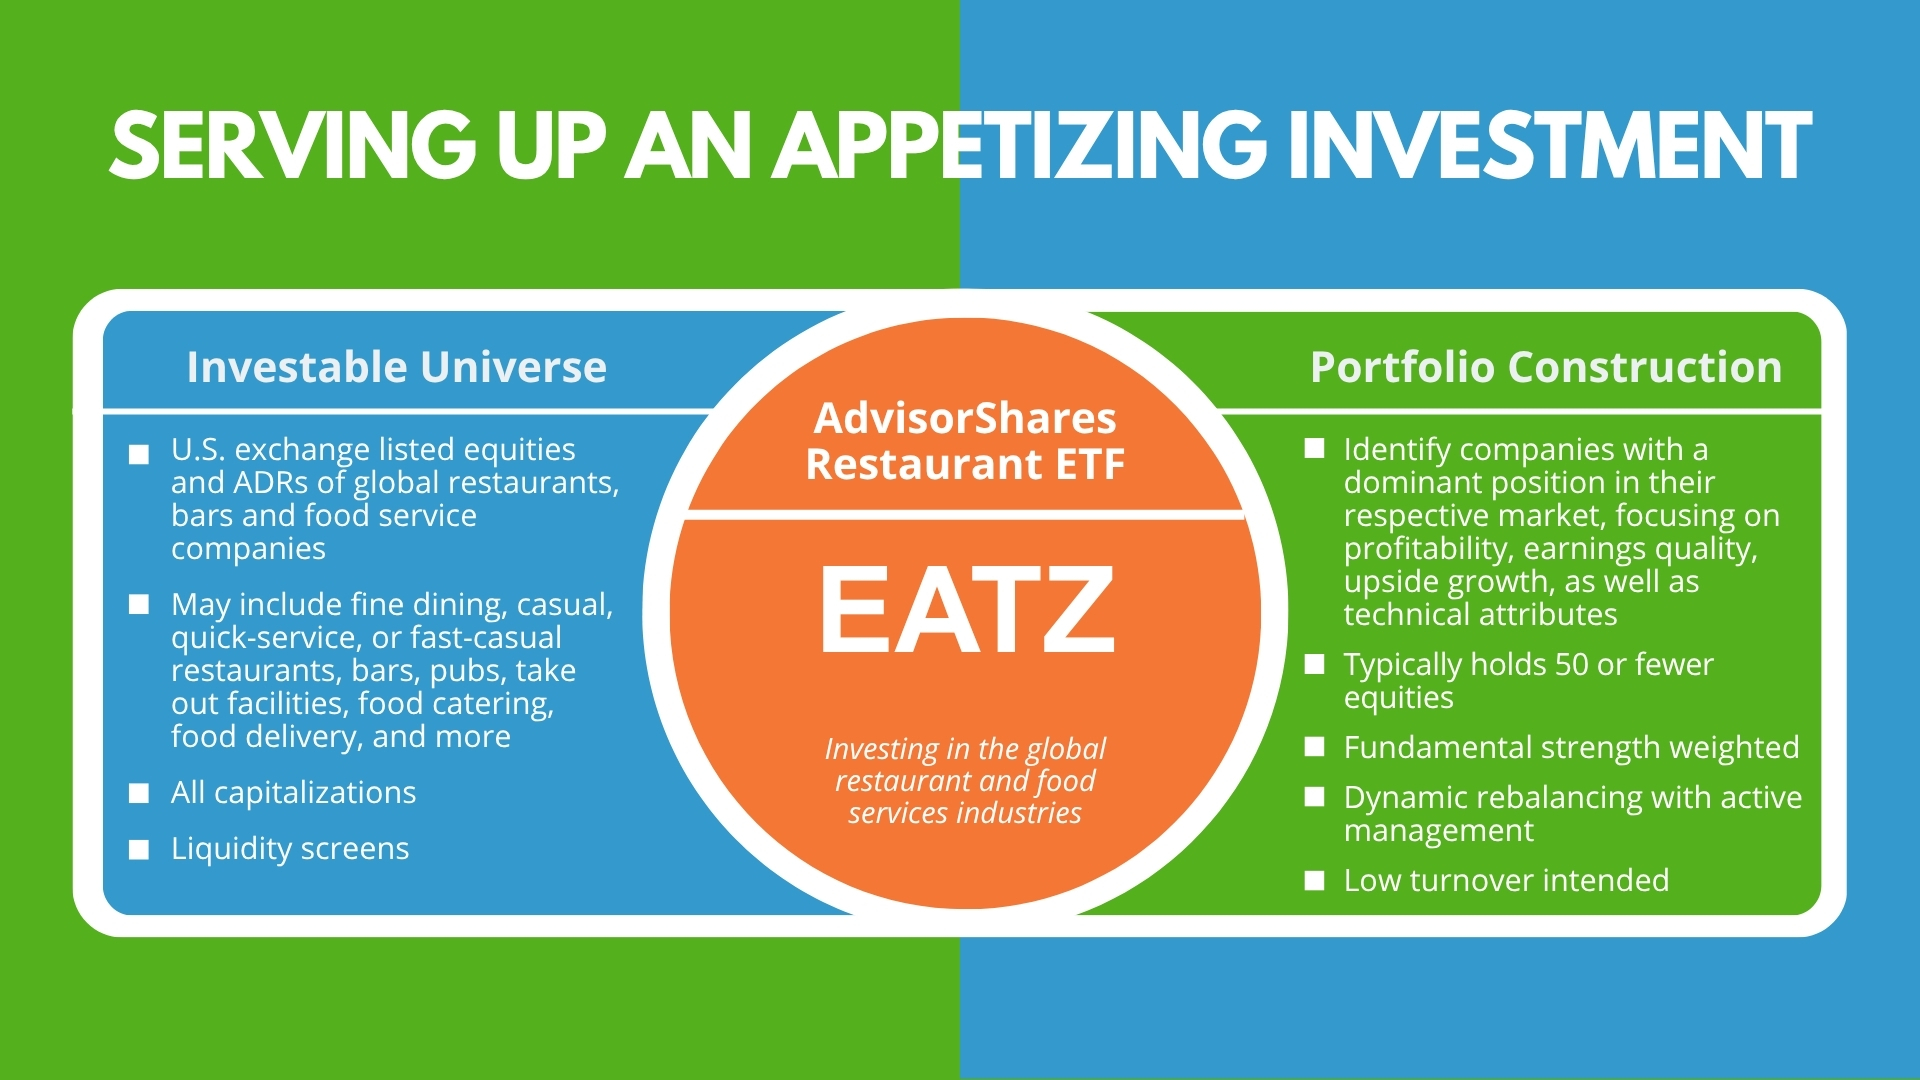
What Does EATZ Invest In?
Why Invest in EATZ?
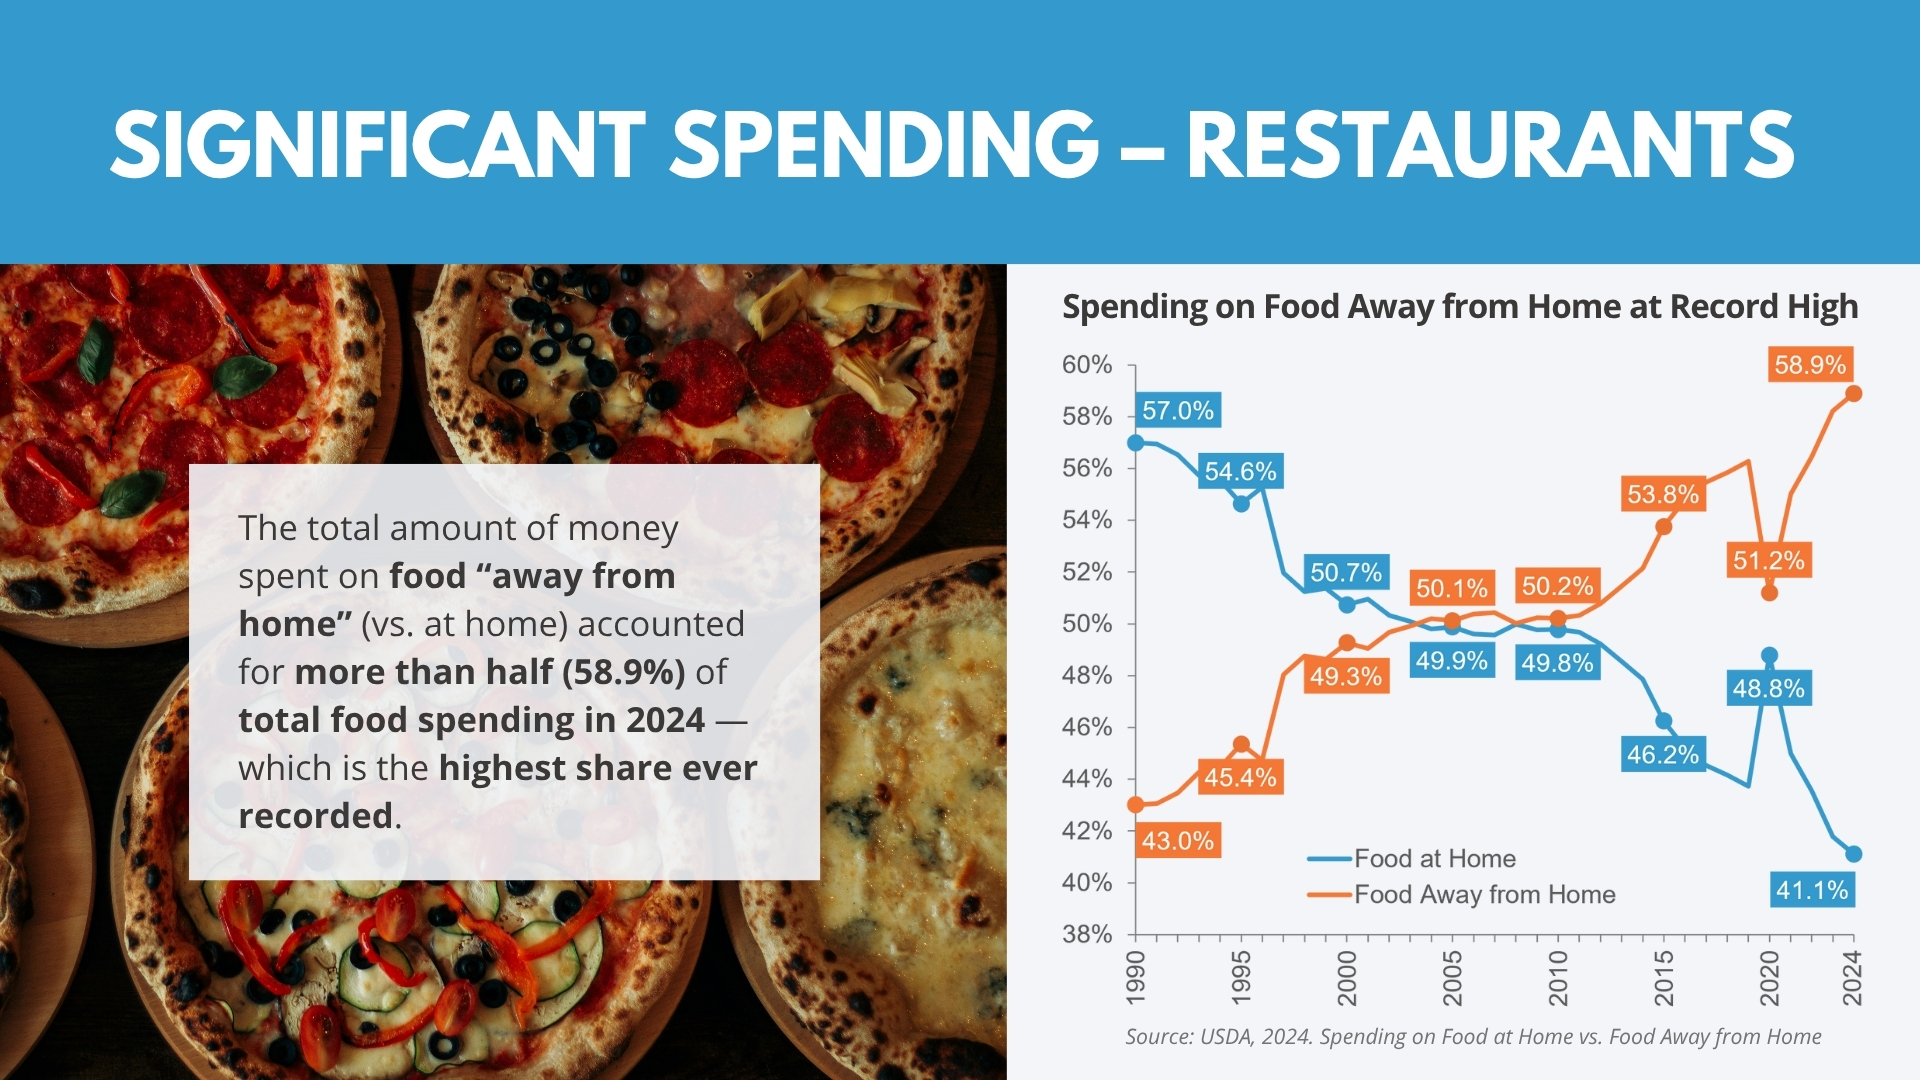
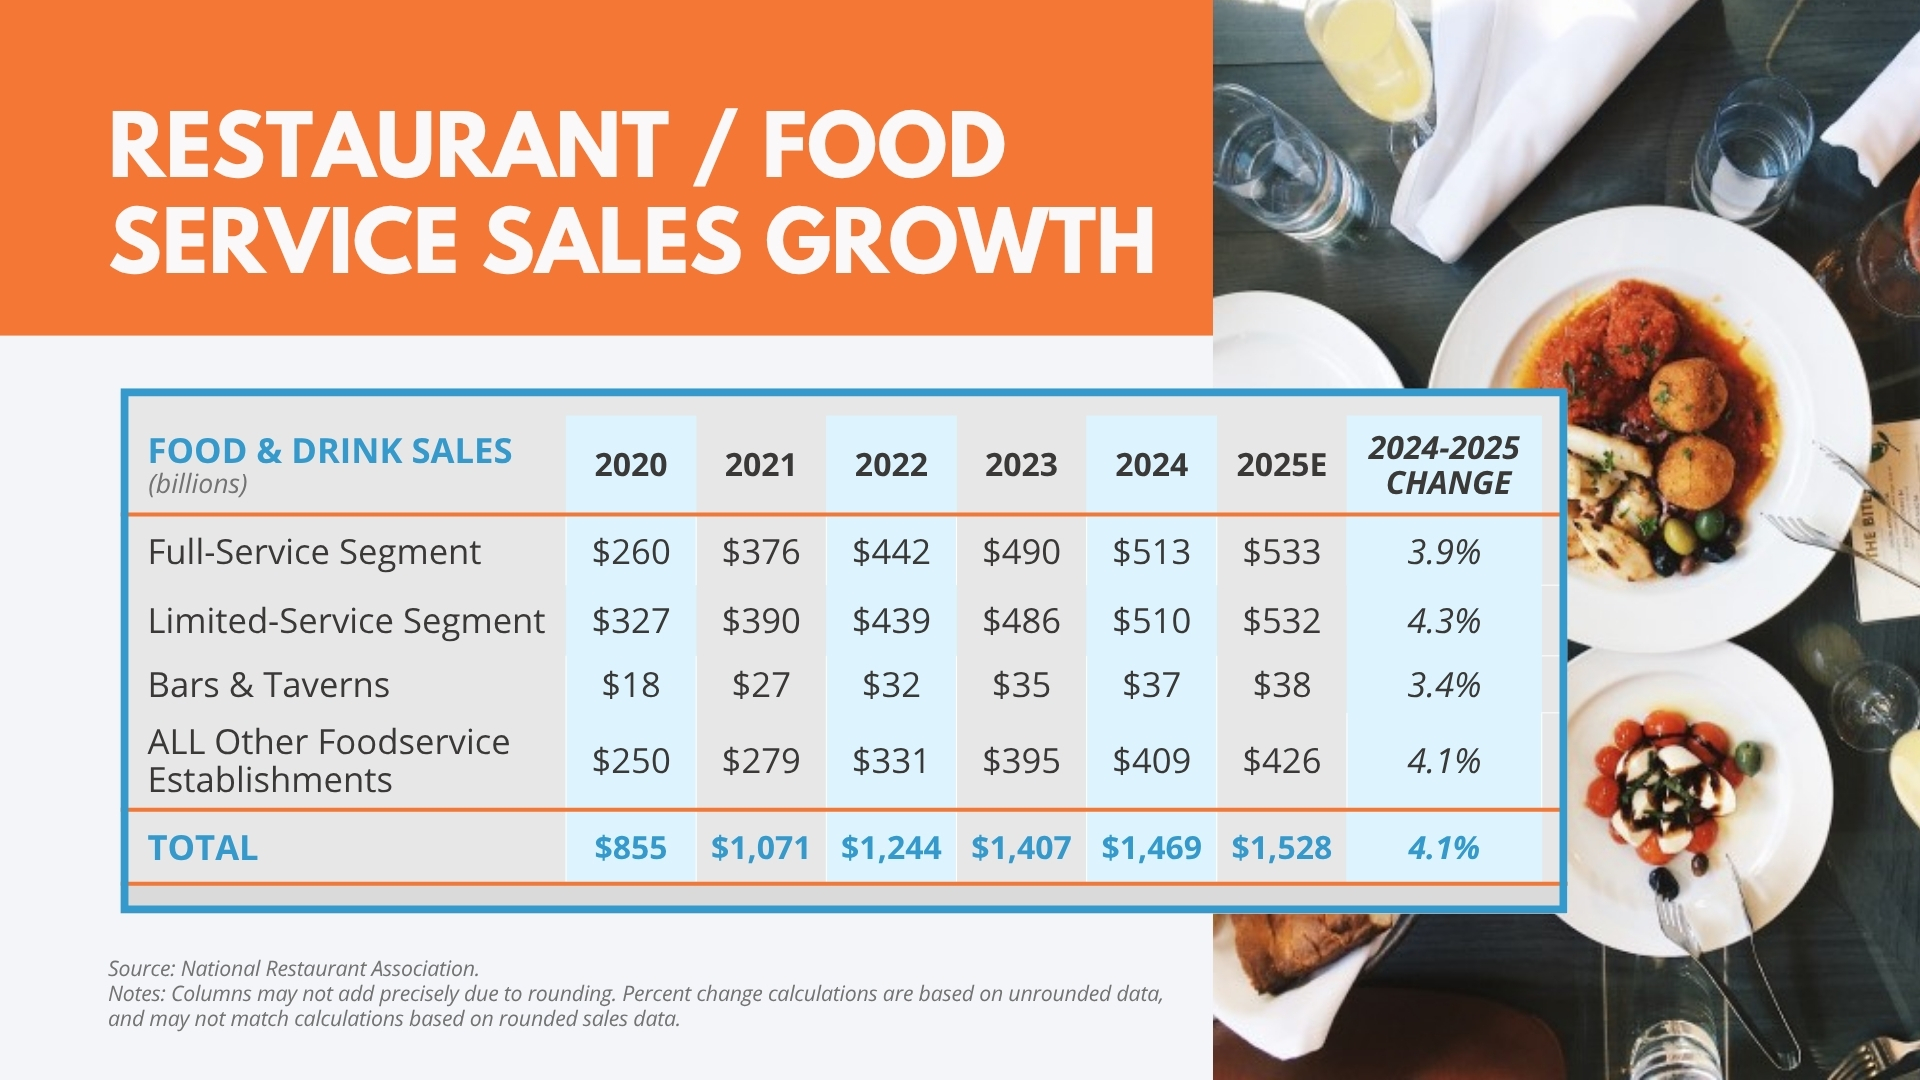
- Long-Term Secular Trend – American’s love of eating out has grown steadily over the last 80+ years – from only 25% in 1955 to 51% in 2019 (pre-pandemic levels). While there was a decline due to the global pandemic, estimates place that spending number back over 50% in the immediate post-pandemic future.1
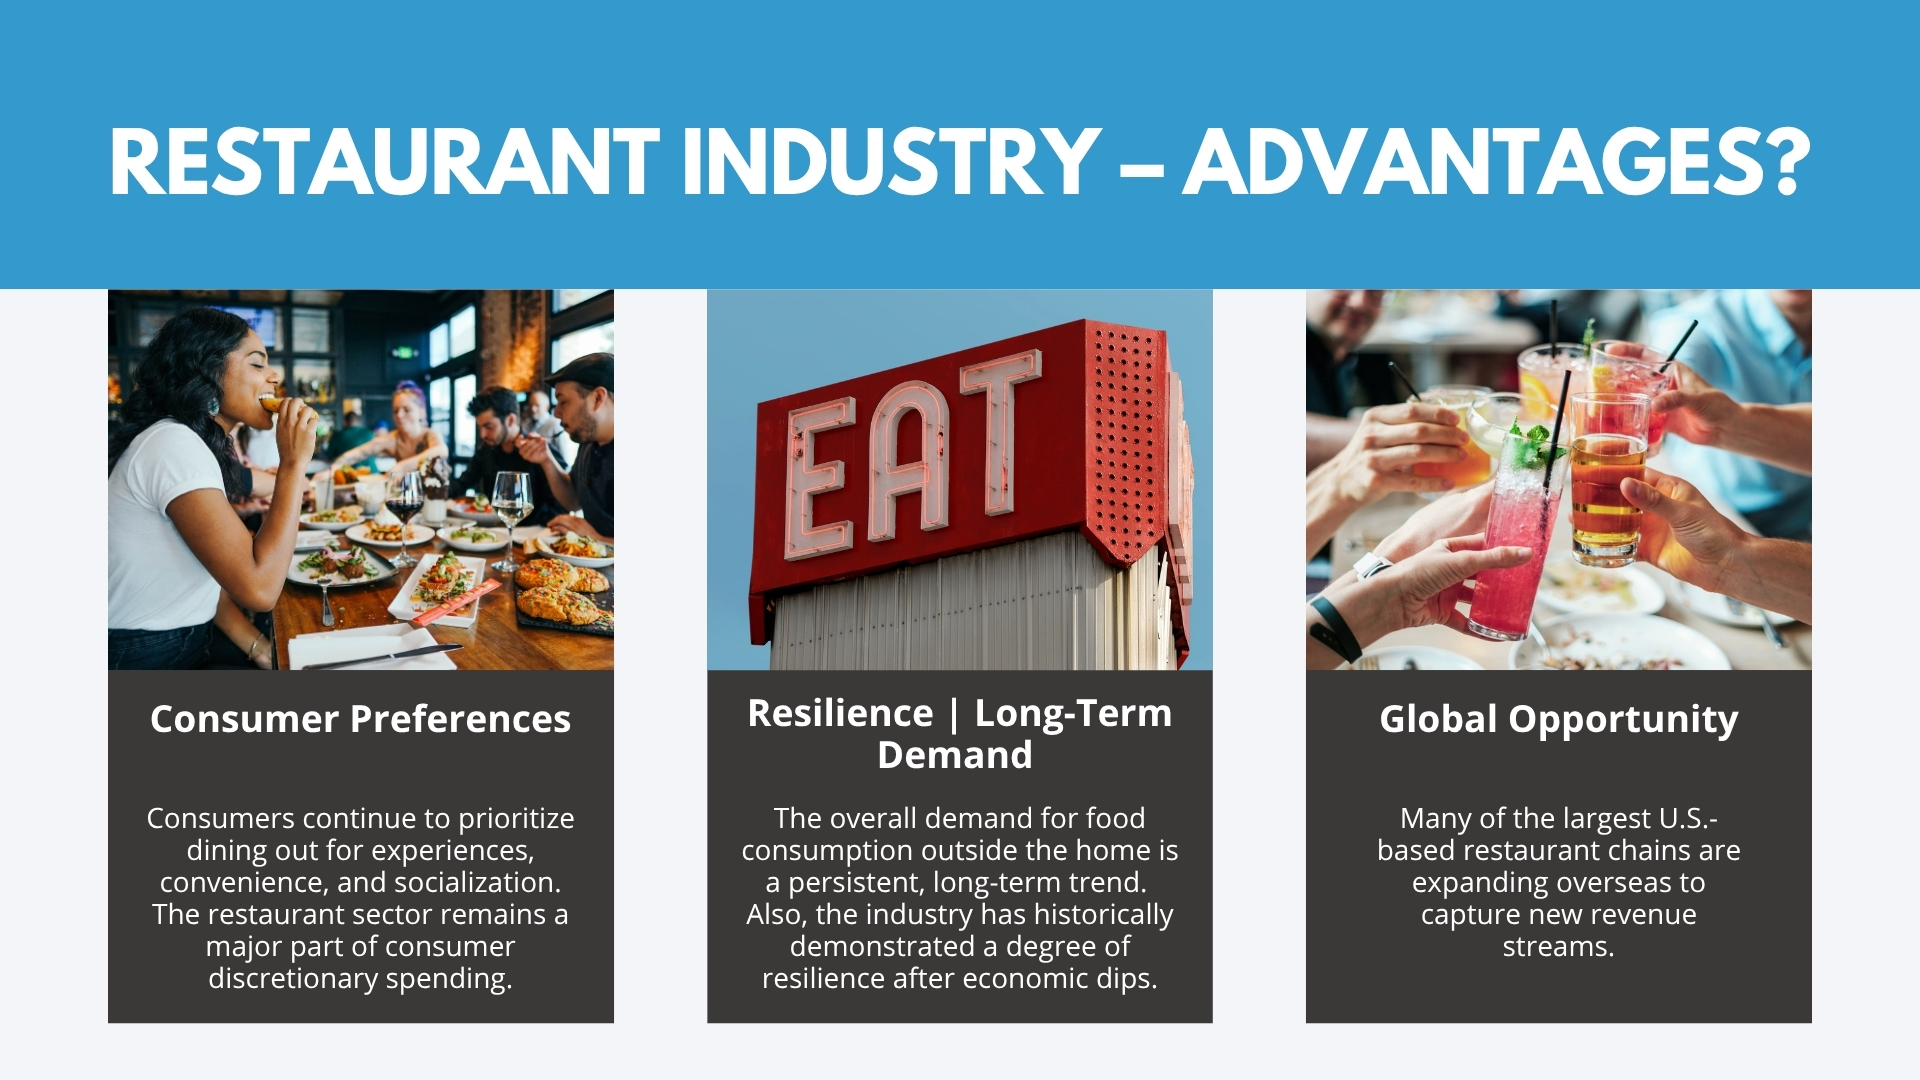
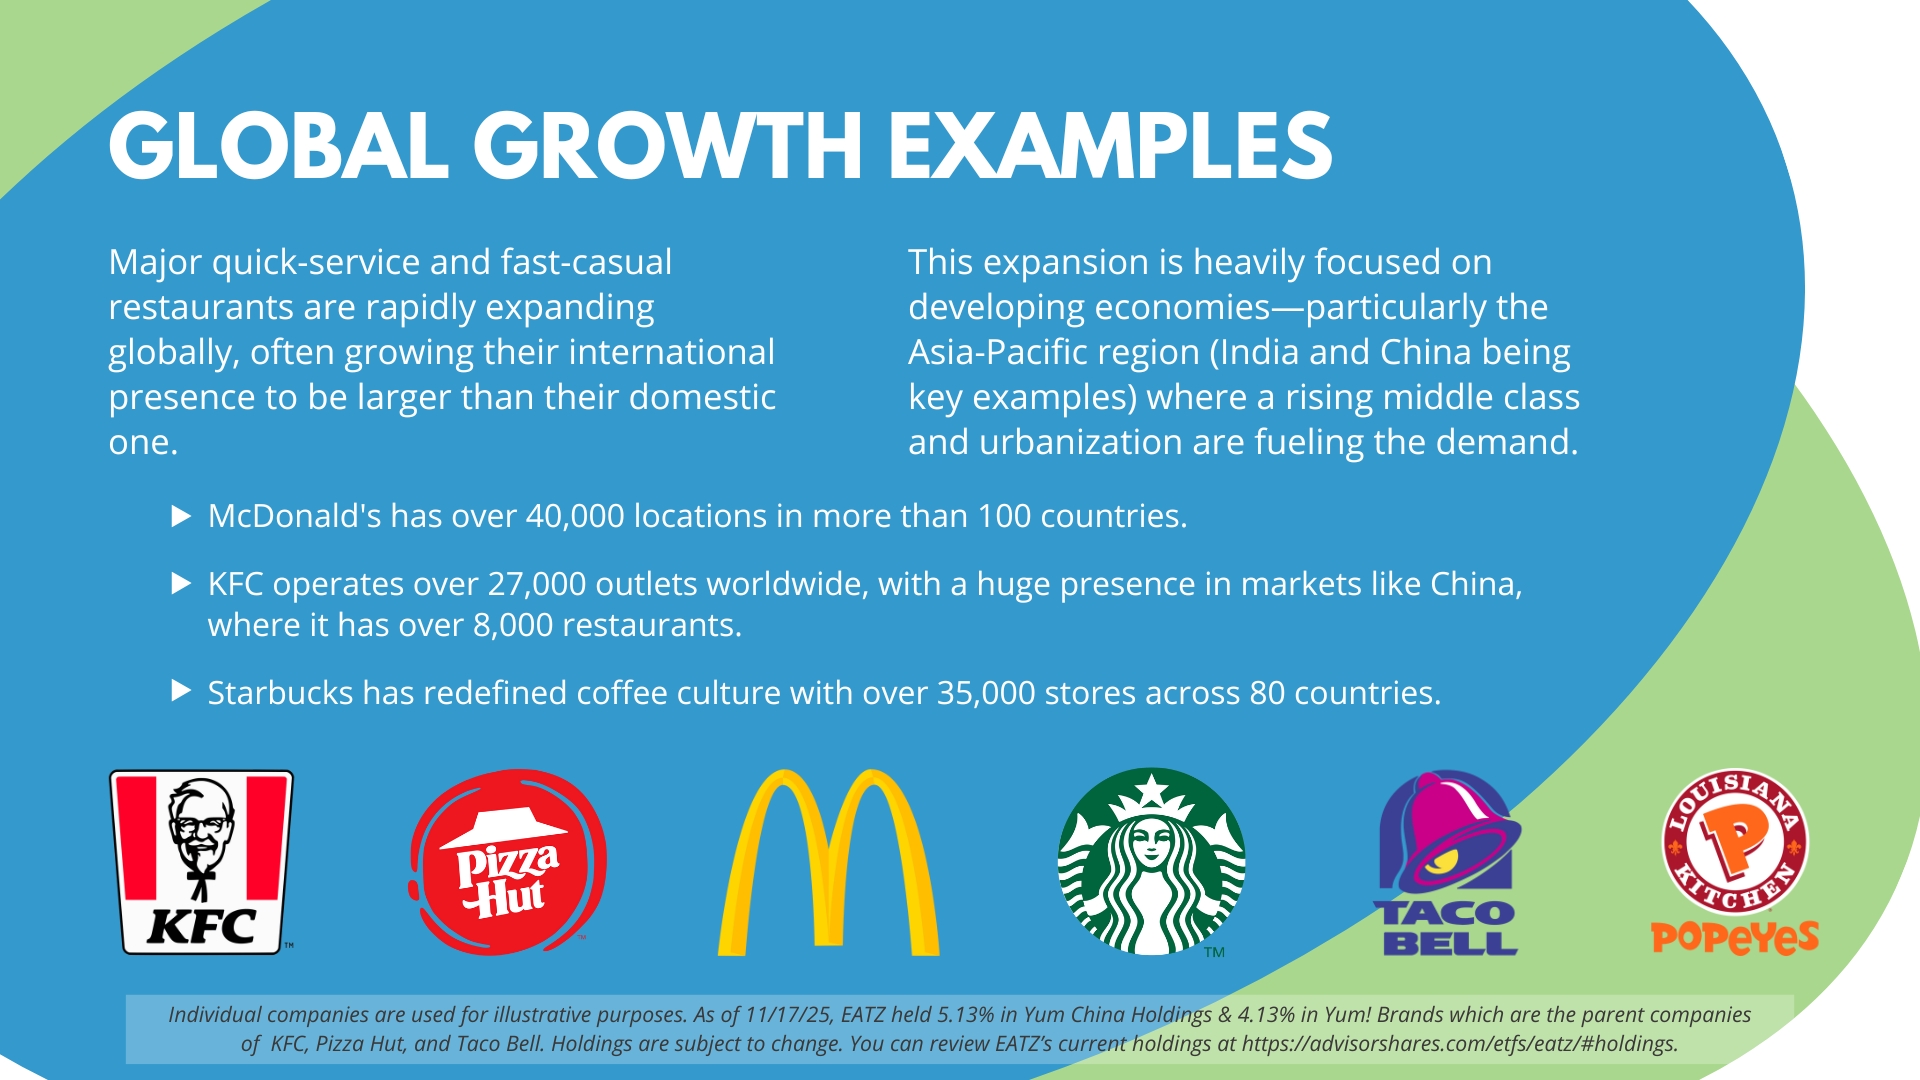
- Global Growth Opportunity – Many of the largest U.S. based restaurant chains have undergone substantial international growth. For example, China has more KFC’s outlets and contributes greater sales than the U.S.
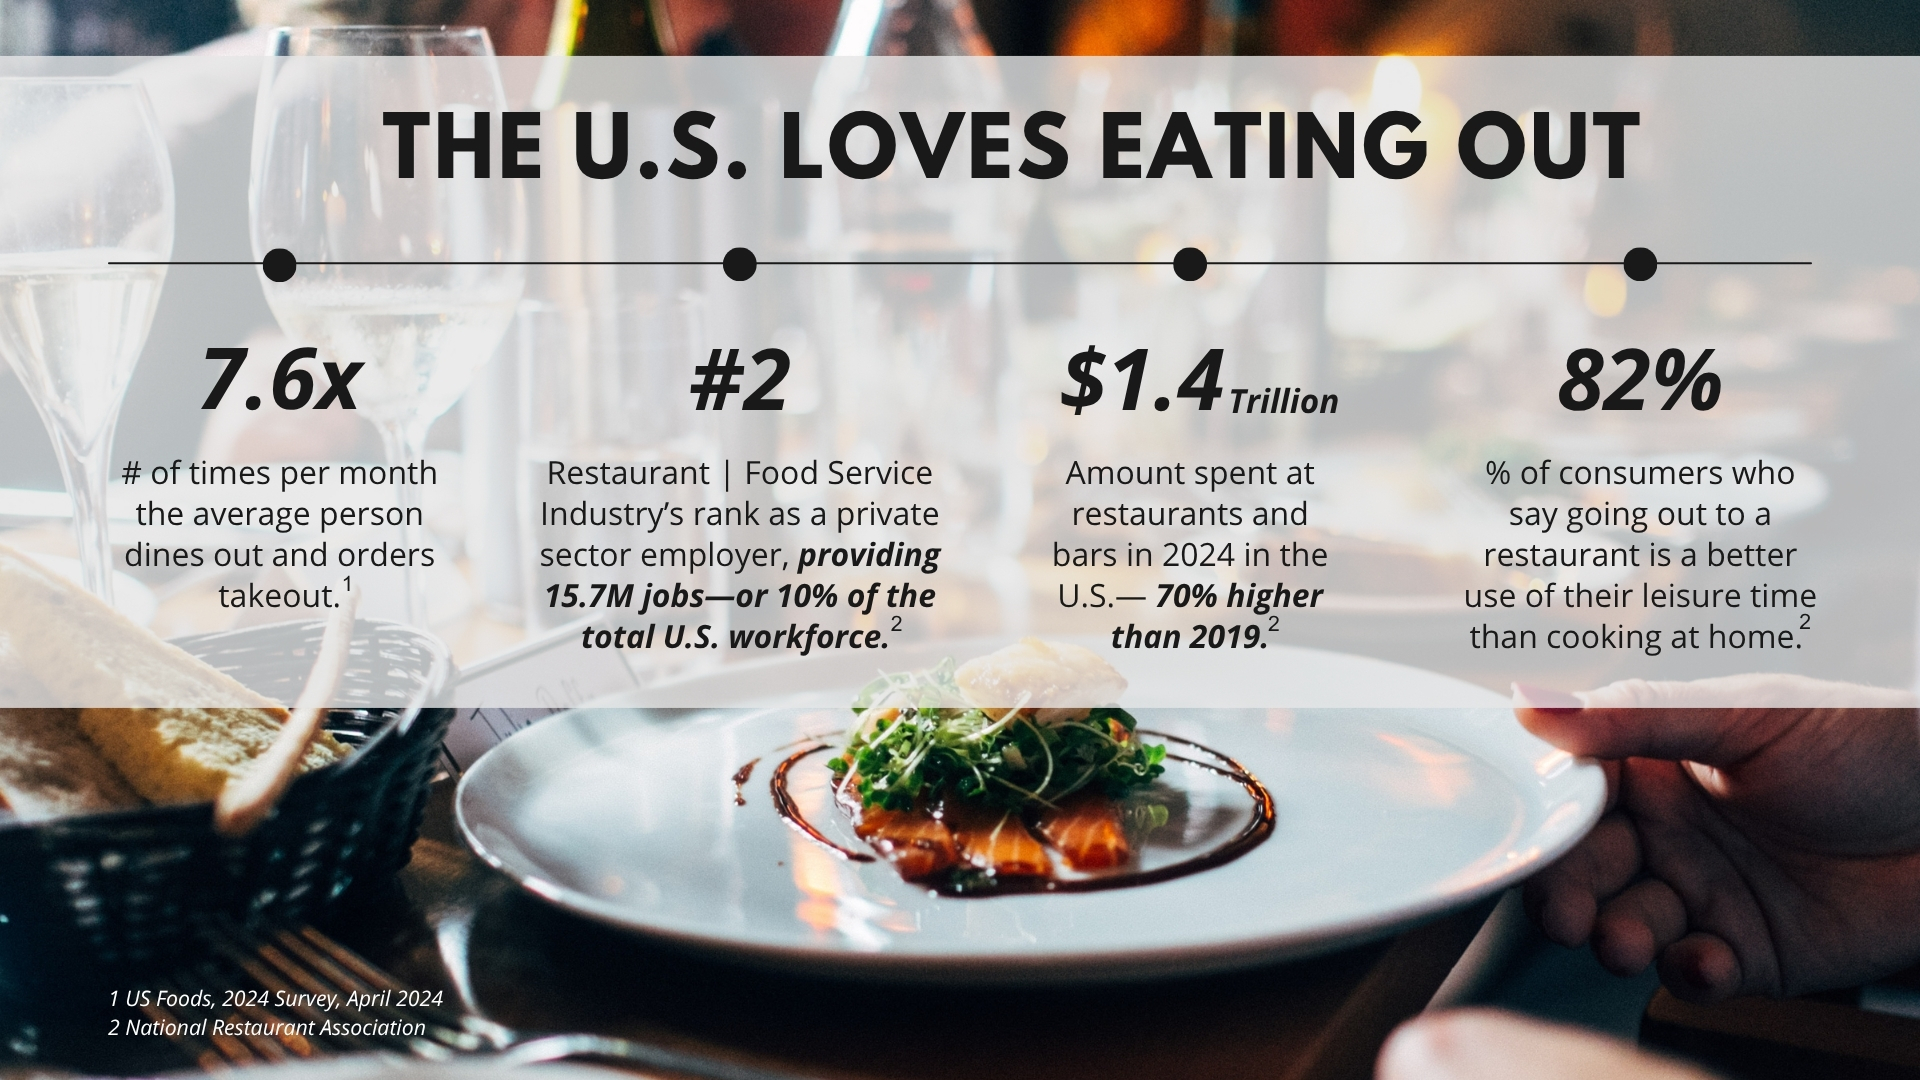
- Pent-Up Demand – COVID-19 forced restaurant operators to become innovative to survive. As the world re-opens, growth expectations for this battered but resourceful sector are high.
Where Can EATZ Fit in a Traditional Portfolio?
Key Attributes
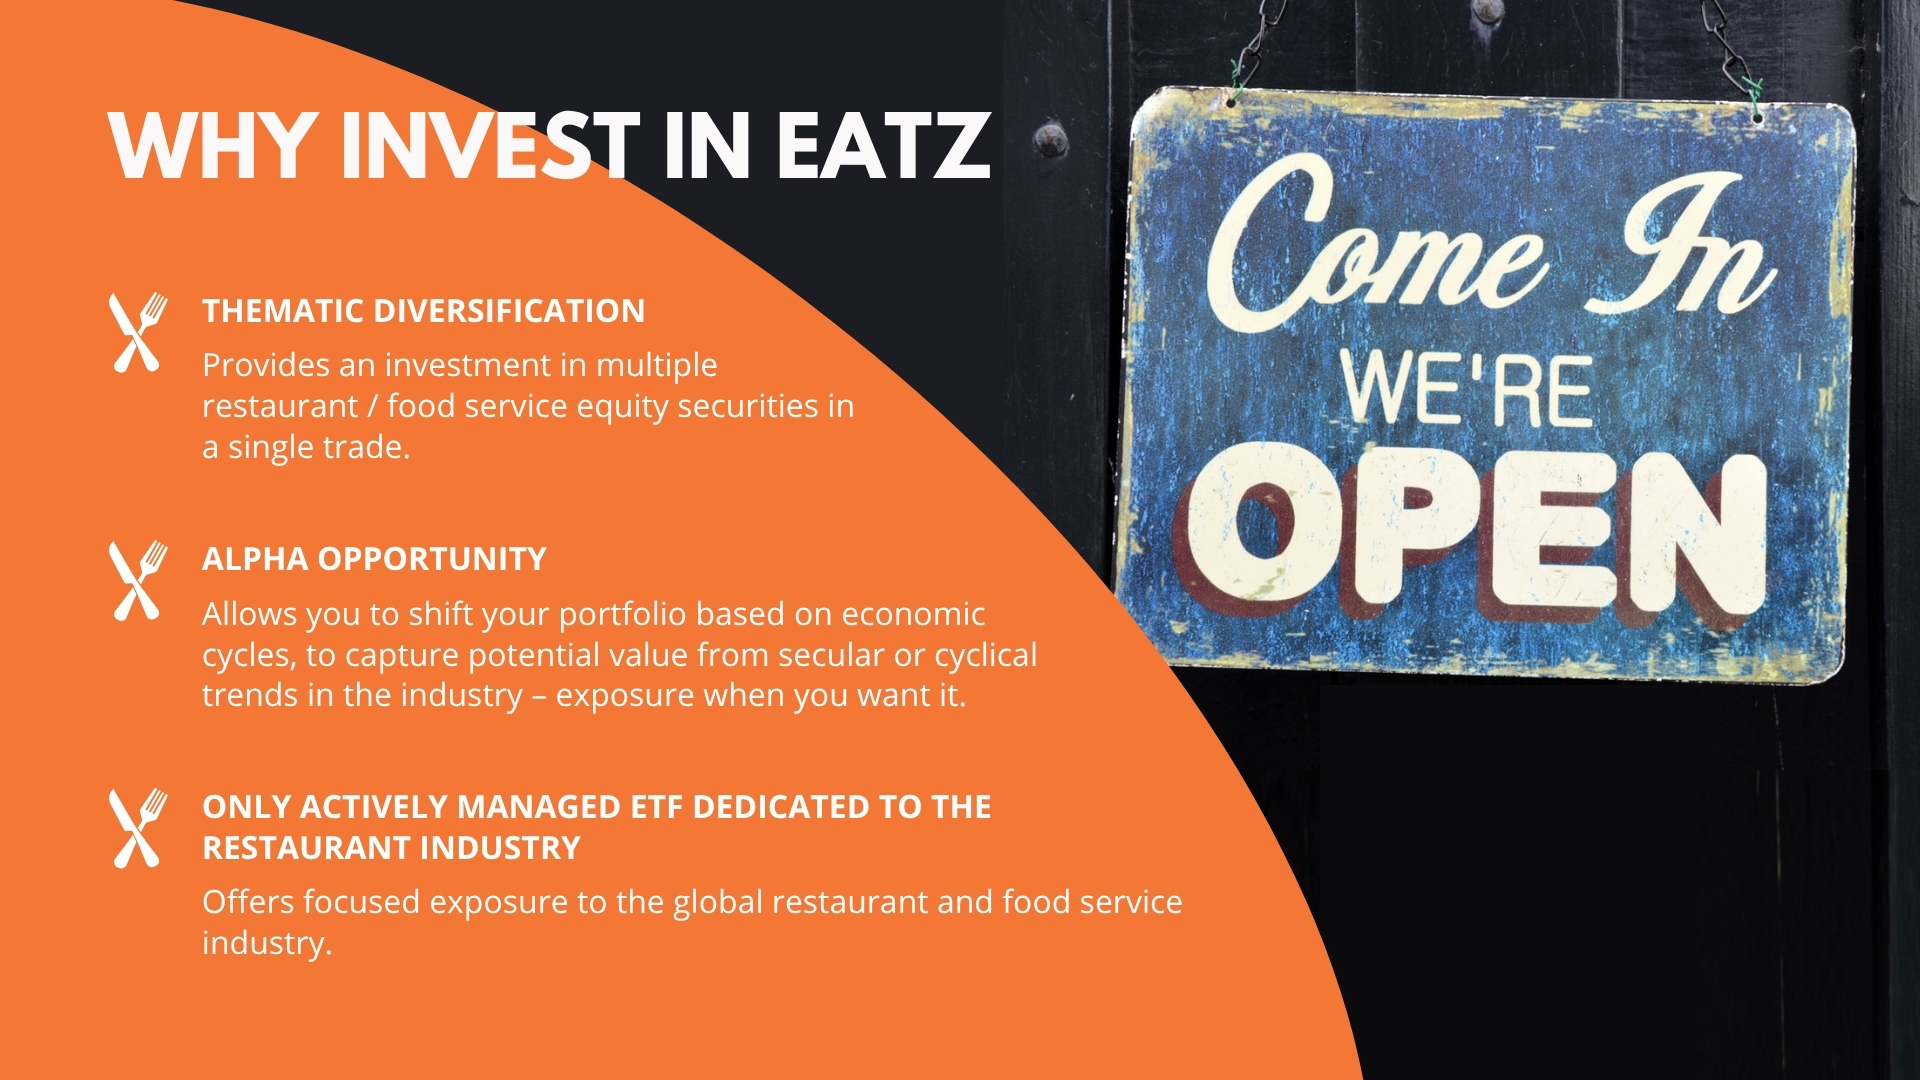
- Thematic Diversification – Allows you to invest in multiple restaurant industry securities in a single trade.
- Only Actively Managed ETF Dedicated to the Restaurant Industry – Offers focused exposure to the global restaurant and foodservice industry when you want it.
- Alpha Opportunity – Allows you to shift your portfolio based on economic cycles and may help capture value from secular or cyclical trends in the industry – exposure when you want it.
About the Portfolio Manager
Mr. Ahrens is a Managing Director and the Chief Operating Officer of AdvisorShares. He is the portfolio manager of several AdvisorShares ETFs: the Pure US Cannabis ETF (ticker: MSOS) – the first and only ETF to offer exclusive US-exclusive cannabis exposure, the MSOS Daily Leveraged (ticker: MSOX), the Pure Cannabis ETF (ticker: YOLO), the Vice ETF (ticker: VICE), the Hotel ETF (ticker: BEDZ), the Restaurant ETF (ticker: EATZ), the Psychedelic ETF (ticker: PSIL), and the HVAC and Industrials ETF (ticker: HVAC).
He carries over two decades of experience in the financial services industry serving in a variety of senior-level capacities and is the author of Investing in Cannabis (Wiley, 2020) and Investing in Vice (St. Martin’s Press, 2004). Additionally, Mr. Ahrens has appeared on numerous financial programs including CNBC, CNN, Fox Business, ABC News and Bloomberg and has been featured, along with funds under his management in major national and trade publications including The Economist, the New York Times, Financial Times, and The Wall Street Journal.

EATZ Overview
Get a quick and easy introduction to the EATZ ETF.
EATZ Overview
Get a quick and easy introduction to the EATZ ETF.
Fund
Price History
Fund Data
4/2/2026| NAV | $26.01 |
| Change | $0.13 |
| Shares Outstanding | 70,000 |
| Assets Under Management | $1,820,544.21 |
Market Data
4/2/2026| Closing Price | $25.98 |
| Close Change | $0.16 |
| Volume | 622 |
Regulatory Data
4/2/2026| Premium Discount | $-0.01 |
| 30-Day Median bid-ask Spread | 0.377501 |
Shares are bought and sold at market price (closing price) not NAV and are not individually redeemed from the Fund. Market price returns are based on the midpoint of the bid/ask spread at 4:00 pm Eastern Time (when NAV is normally determined), and do not represent the return you would receive if you traded at other times.
")
FUND
Characteristics
As of 2/28/2026
FUND
Performance
As of 3/31/2026
| NAV | Market Price Return | S&P 500 Index | |
|---|---|---|---|
| 1 Month | -7.59 | -7.60 | -4.98 |
| 3 Months | -0.81 | -0.85 | -4.33 |
| YTD | -0.81 | -0.85 | -4.33 |
| 1 Year | -4.69 | -4.81 | 17.80 |
| 3 Year | 9.33 | 9.31 | 18.32 |
| Since Inception (4/20/2021) | 1.63 | 1.62 | 11.29 |
Get Social @AdvisorShares
Join the conversation on social media to hear more from the portfolio manager, get informed about upcoming events and webinars, and more!
| Date | Account Symbol | Stock Ticker | Security ID | Security Description | Shares | Share Price | Market Value | Portfolio Weight | Asset Group |
|---|---|---|---|---|---|---|---|---|---|
| 04/02/2026 | EATZ | EAT | 109641100 | BRINKER INTERNATIONAL INC | 1,206 | 144.69 | 174,496.14 | 9.58% | S |
| USFD | 912008109 | US FOODS HOLDING CORP | 1,315 | 89.91 | 118,231.65 | 6.49% | S | ||
| CASY | 147528103 | CASEY'S GENERAL STORES INC | 155 | 743.42 | 115,230.10 | 6.33% | S | ||
| QSR | 76131D103 | RESTAURANT BRANDS INTERN | 1,366 | 76.58 | 104,608.28 | 5.75% | FS | ||
| DNUT | 50101L106 | KRISPY KREME INC | 30,000 | 3.40 | 102,000.00 | 5.60% | S | ||
| YUM | 988498101 | YUM! BRANDS INC | 594 | 156.09 | 92,717.46 | 5.09% | S | ||
| DRI | 237194105 | DARDEN RESTAURANTS INC | 458 | 196.33 | 89,919.14 | 4.94% | S | ||
| YUMC | 98850P109 | YUM CHINA HOLDINGS INC | 1,773 | 49.19 | 87,213.87 | 4.79% | S | ||
| NATH | 632347100 | NATHAN'S FAMOUS INC | 850 | 100.68 | 85,578.00 | 4.70% | S | ||
| CAKE | 163072101 | CHEESECAKE FACTORY INC/THE | 1,523 | 55.23 | 84,115.29 | 4.62% | S | ||
| DPZ | 25754A201 | DOMINO'S PIZZA INC | 198 | 370.82 | 73,422.36 | 4.03% | S | ||
| TXRH | 882681109 | TEXAS ROADHOUSE INC | 443 | 162.98 | 72,200.14 | 3.97% | S | ||
| BJRI | 09180C106 | BJ'S RESTAURANTS INC | 1,900 | 35.84 | 68,096.00 | 3.74% | S | ||
| DIN | 254423106 | DINE BRANDS GLOBAL INC | 2,643 | 25.50 | 67,396.50 | 3.70% | S | ||
| BROS | 26701L100 | DUTCH BROS INC-CLASS A | 1,202 | 50.35 | 60,520.70 | 3.32% | S | ||
| ARMK | 03852U106 | ARAMARK | 1,395 | 42.55 | 59,357.25 | 3.26% | S | ||
| RRGB | 75689M101 | RED ROBIN GOURMET BURGERS | 18,546 | 3.06 | 56,750.76 | 3.12% | S | ||
| DASH | 25809K105 | DOORDASH INC - A | 262 | 156.45 | 40,989.90 | 2.25% | S | ||
| SERV | 81758H106 | SERVE ROBOTICS INC | 4,822 | 8.45 | 40,745.90 | 2.24% | S | ||
| WING | 974155103 | WINGSTOP INC | 145 | 152.51 | 22,113.95 | 1.21% | S | ||
| X9USDBLYT | BLACKROCK TREASURY TRUST INSTL 62 | 240,345.21 | 1.00 | 240,345.21 | 13.20% | MM | |||
| CASH | -35,530.48 | 100.00 | -35,530.48 | -1.95% | CA |


FUND
Annual Fund Operating Expenses (expenses that you pay each year as a percentage of the value of your investment)
| Management Fee | 0.60% | |
| Other Expenses | 2.36% | |
| Recaptured Fees/Expenses* | 0.01% | |
| Gross Expense Ratio | 2.97% | |
| Fee Waiver/Expense Reimbursement* | -1.97% | |
| Net Expense Ratio | 1.00% |
| Expense Cap Limitation* | 0.99% |
*Total Annual Operating Expenses and Total Annual Operating Expenses After Waiver/Reimbursement in this fee table may not correlate to the expense ratios in the Fund’s financial highlights because the financial highlights include only the Fund’s direct operating expenses and do not include Acquired Fund Fees and Expenses, which represent the Fund’s pro rata share of the fees and expenses of money market funds in which it invests. Total Annual Operating Expenses and Total Annual Operating Expenses After Wavier/Reimbursement in this fee table may not correlate to the expense ratios in the Fund’s financial highlights. The Advisor has contractually agreed to keep net expenses from exceeding 0.99% of the Fund’s average daily net assets for at least one year from the date of the prospectus. For more information, please read the full prospectus.
Last Ten
Fund Distributions
")
-
-
- The industry information presented above is for informational purposes only and may not be reflective of an investment in the Fund.
- 1 Historical data is from the National Restaurant Association; forecast data is from Morgan Stanley Research.
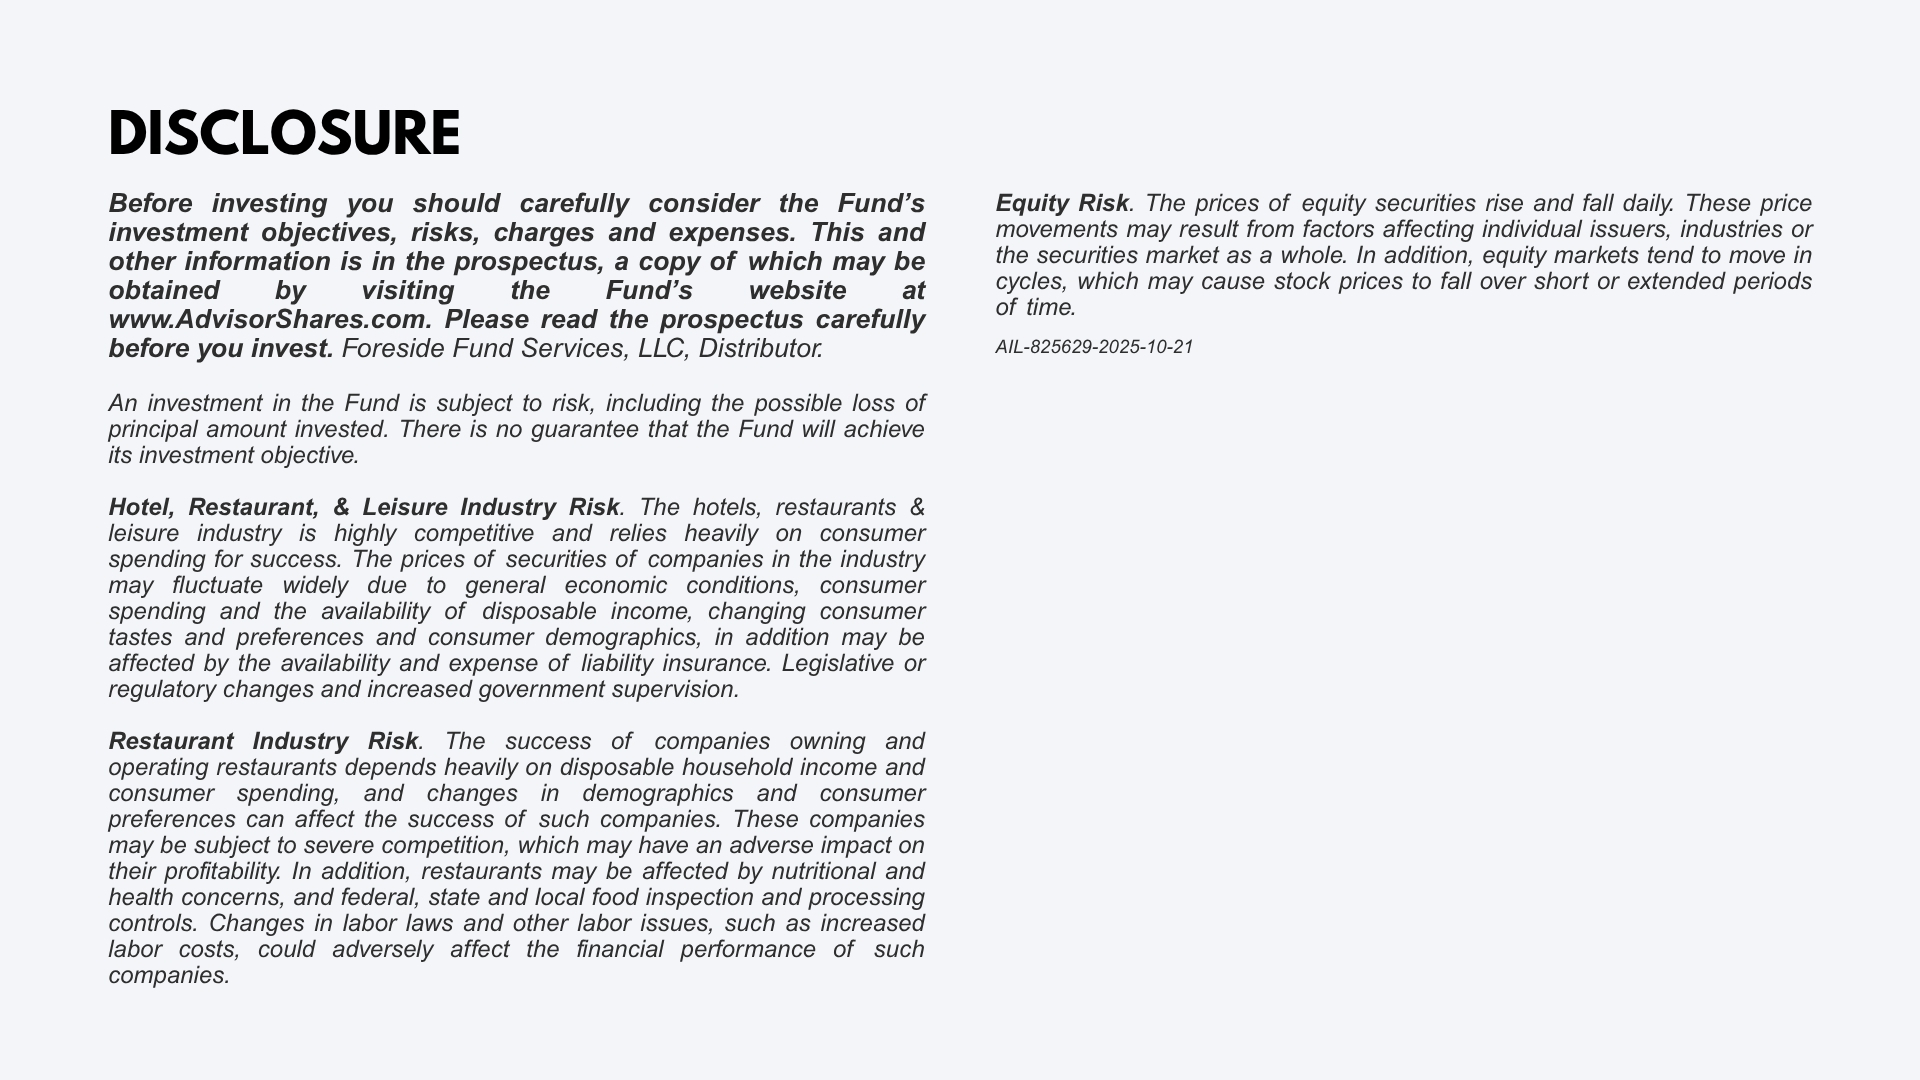
- Before investing you should carefully consider the Fund’s investment objectives, risks, charges and expenses. This and other information is in the prospectus, a copy of which may be obtained by visiting the Fund’s website at www.AdvisorShares.com. Please read the prospectus carefully before you invest. Foreside Fund Services, LLC, Distributor.
- An investment in the Fund is subject to risk, including the possible loss of principal amount invested. There is no guarantee that the Fund will achieve its investment objective.Hotel, Restaurant, & Leisure Industry Risk. The hotels, restaurants & leisure industry is highly competitive and relies heavily on consumer spending for success. The prices of securities of companies in the industry may fluctuate widely due to general economic conditions, consumer spending and the availability of disposable income, changing consumer tastes and preferences and consumer demographics, in addition may be affected by the availability and expense of liability insurance. Legislative or regulatory changes and increased government supervision. Restaurant Industry Risk. The success of companies owning and operating restaurants depends heavily on disposable household income and consumer spending, and changes in demographics and consumer preferences can affect the success of such companies. These companies may be subject to severe competition, which may have an adverse impact on their profitability. In addition, restaurants may be affected by nutritional and health concerns, and federal, state and local food inspection and processing controls. Changes in labor laws and other labor issues, such as increased labor costs, could adversely affect the financial performance of such companiesAmerican Depositary Receipt Risk. ADRs have the same currency and economic risks as the underlying non-U.S. shares they represent. They are affected by the risks associated with non-U.S. securities, such as changes in political or economic conditions of other countries, changes in the exchange rates of, or exchange control regulations associated with, foreign currencies, and differing accounting, auditing, financial reporting, and legal standards and practices. In addition, investments in ADRs may be less liquid than the underlying securities in their primary trading market.
Equity Risk. The prices of equity securities rise and fall daily. These price movements may result from factors affecting individual issuers, industries or the securities market as a whole. In addition, equity markets tend to move in cycles, which may cause stock prices to fall over short or extended periods of time.
-
- DEFINITIONS:
- ADR: An American Depositary Receipt (ADR) is a negotiable U.S. Security that generally represents a company’s publicly traded equity or debt. Depositary Receipts are created when a broker purchases a non-U.S. company’s shares on its home stock market and delivers the shares to the depositary’s local custodian bank, and then instructs the depositary bank to issue Depositary Receipts.
- Alpha: Alpha, one of the most commonly quoted indicators of investment performance, is defined as the excess return on an investment relative to the return on a benchmark index.
ETF Social Conversation