CWS: 1st Quarter 2026 Portfolio Review
Market Review
The first quarter of this year was a set of contrasts for Wall Street. We had a rising market and a falling market. We had the possibility of a Fed rate cut and the possibility of a Fed rate increase. And we also had war and peace.
The stock market started Q1 on the right foot. The S&P 500 made a new all-time high on January 27. For the next month, the market slowly lost its footing. The S&P 50 fell some, but not much.
Then came the announcement of hostilities between the United States and Iran. The price of oil quickly shot up over $100 per barrel. Before the end of March, consumers were dealing with gasoline prices of $4 per gallon at the pump.
High gas prices are terrible for the economy. It’s essentially a tax on U.S. consumers. It’s not surprising that nearly every recession since the Great Depression has started with an oil price shock.
During Q1, Wall Street continued its obsession with AI. The difference this time is that some large-cap tech stocks started to falter. That’s a big difference from 2025, when many tech stocks acted like superheroes.
We also had continued strength in international markets. That was due to a weaker U.S. dollar.
Portfolio Review
Let’s take a closer look at our portfolio and see what drove some of our performance.
On March 9, one of our new stocks this year, Casey’s General Stores (CASY), reported very good earnings for its fiscal Q3 (ending on January 31).
Earnings rose 50% to $3.49 per share. That blew past Wall Street’s consensus of $2.97 per share.
Inside-same-store sales rose by 4.0%. Same-store fuel gallons were up 0.4%, with a fuel margin of 41.0 cents per gallon. Total fuel gross profit increased 15.3% to $348.2 million. During the quarter, Casey’s Rewards surpassed 10 million members.
Total inside sales for the quarter were up 5.7%, thanks to an increase of 130 basis points to margins. During the quarter, Casey’s bought back $76 million of its own shares. There’s still $157 million left in the current authorization.
Now let’s look at guidance. There’s only one quarter left in the company’s fiscal year, and Casey’s expects EBITDA to increase by 18% to 20%. The company also expects inside-same-store sales to increase 3.5% to 4.5% and an inside margin of approximately 41.5% to 42.5%. Casey’s sees same-store fuel gallons sold to be unchanged. I’m expecting big things from Casey’s.
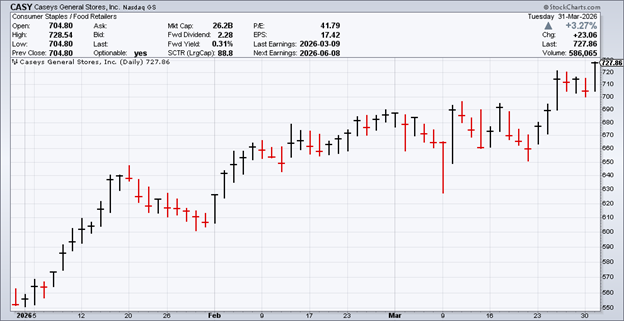
Source: StockCharts.com; from 01.01.2026 to 03.31.2026. Past performance is no guarantee of future returns.
On January 28, Amphenol (APH) reported another outstanding quarter. For its fiscal Q4, APH had earnings of 97 cents per share. That’s up 76% over last year. The company had been expecting earnings between 89 and 91 cents per share.
Quarterly sales were up 49% in U.S. dollars and 37% organically to $6.4 billion. For the quarter, Amphenol had operating-cash flow of $1.7 billion and free-cash flow of $1.5 billion.
For the entire year, Amphenol’s earnings were up 77% to $3.34 per share. Full-year sales were up 52% in U.S. dollars and 38% organically to $23.1 billion. Amphenol had been expecting sales of $22.66 to $22.76 billion, and earnings of $3.26 to $3.28 per share.
Amphenol is also rewarding shareholders. During Q4, Amphenol bought back 1.3 million shares for $171 million and paid dividends of $202 million. In 2025, the company returned nearly $1.5 billion to shareholders.
FICO (FICO) said it made $7.33 per share for its fiscal Q1. That’s up 27% from a year ago, and it beat Wall Street’s consensus for $7.08 per share. Revenues rose 16% to $512 million.
CEO Will Lansing said, “We had a good start to our fiscal year, with strong top- and bottom-line growth.” FICO also stood by its previous full-year guidance for earnings of $38.17 per share and revenue of $2.35 billion. That’s an optimistic outlook. Last year, FICO made $29.88 per share.
For Q1, Scores had revenue growth of 29% to $304.5 million. B2B revenue increased 36%. Software revenues, which include the company’s analytics and digital-decisioning technology, were up 2% to $207.5 million.
Resmed (RMD), another one of our new stocks this year, said it made $2.81 per share for its fiscal Q2, ending in December. That was nine cents ahead of expectations.
Quarterly revenue increased 11% to $1.4 billion and was up 9% on a constant-currency basis. Gross margin was up 310 basis points to 62.3%. Income from operations increased 19%, and operating-cash flow was $340 million.
CEO Mick Farrell said, “Year over year, we delivered 11% headline revenue growth, 310 basis points of non-GAAP gross-margin expansion and continued operating excellence, resulting in another quarter of mid-teens non-GAAP EPS growth. These results reflect strong ongoing demand for our market-leading sleep and respiratory-care devices, as well as the growing impact of our digital health ecosystem that spans more than 140 countries.”
On January 29, Stryker (SYK) reported very good numbers for Q4. Earnings rose 11.5% to $4.47 per share. That was eight cents better than expectations. Stryker’s own guidance had been for $4.34 to $4.44 per share.
Net sales were up 11.4% to $7.2 billion, and organic sales were up 11.0%. Stryker’s operating margin increased 100 basis points to 30.2%. For the year, Stryker made $13.63 per share. That’s up 11.8% over last year.
For 2026, Stryker expects earnings between $14.90 and $15.10 per share, and organic-net-sales growth of 8.0% to 9.5%. If that’s correct, then it would be another good year for SYK.
Thermo Fisher Scientific (TMO) reported that Q4 earnings grew 8% to $6.57 per share. That beat expectations of $6.45 per share. Q4 revenue grew 7% to $12.21 billion. Organic-revenue growth was 3%.
Full-year revenue grew 4% to $44.56 billion, and 2025 earnings were up 5% to $22.87 per share. Adjusted operating margin was 22.7%, compared with 22.6% in 2024.
On the earnings call, Thermo offered guidance for 2026. The company expects revenue growth of 4% to 6%, which comes out to $46.3 billion to $47.2 billion. Thermo also sees earnings ranging between $24.22 to $24.80 per share. That works out to growth of 6% to 8%.
Broadridge Financial Solutions (BR) said it made $1.59 per share for its fiscal Q2. Wall Street had been expecting $1.36 per share.
For the quarter, Broadridge’s revenues rose by 8%, and its recurring revenues increased by 9%. The company also reaffirmed its guidance for recurring-revenue growth at the “higher end” of its range of 5% to 7%. BR also sees continued margin expansion and closed sales of $290 to $330 million.
The best news is that Broadridge raised its full-year earnings-growth guidance to a range of 9% to 12%. The previous range was 8% to 12%. It’s not a huge increase, but it tells us that business is going well. Since BR made $8.55 per share last year, the new earnings range works out to $9.32 to $9.58 per share.
Mueller Industries (MLI) reported Q4 earnings of $1.38 per share. That’s up 14% over last year. Since it’s so small, there’s no earnings consensus. Net sales were up 4.2% to $962.4 million.
During the quarter, copper averaged $5.13 per pound. That’s up 22% over last year. That was a huge help for Mueller. During Q4, the company generated $141.2 million of cash from operations. Year-end cash and short-term investments came to $1.39 billion, and Mueller’s current ratio is 5.9 to 1.
Cencora (COR) said its Q1 earnings rose 9.4% to $4.09 per share. That was five cents more than Wall Street’s estimate. Cencora’s Q1 revenues rose 5.5% to $85.9 billion. This is another stock that’s done well for us.
Cencora recently bought the equity it didn’t already own in OneOncology, a leading management-services organization for oncology practices.
With this earnings report, Cencora raised its guidance for operating earnings. The previous range was for growth of 8% to 10%. It sees operating-income growth of 11.5% to 12.5%. The company said this reflects “completion of the acquisition of OneOncology and the performance of the U.S. Healthcare Solutions segment.”
I was glad to see Cencora stand by its full-year earnings-guidance range of $17.45 to $17.75 per share. That’s compared with $16.00 per share last year.
McKesson (MCK) was our big star this earnings season. For its fiscal Q3, the healthcare outfit had earnings of $9 per share. That’s an increase of 16% over last year, and it beat Wall Street’s expectations by seven cents per share.
Here are some details: Quarterly consolidated revenue increased 11% to $106.2 billion. McKesson generated $1.2 billion of cash flow from operations and $1.1 billion of free-cash flow.
McKesson also raised and narrowed its full-year guidance. The company now sees 2026 earnings of $38.80 to $39.20 per share. That’s up from the previous range of $38.35 to $38.85 per share. That new guidance represents growth of 17% to 19%.
CEO Brian Tyler said, “McKesson delivered another strong quarter, extending the momentum we’ve built across the enterprise and demonstrating the impact of our disciplined execution.” McKesson is also moving ahead with its plans to separate the Medical-Surgical Solutions unit.
After the earnings were released, the stock shot out of the gate. Shares of MCK reached a new all-time high, and by the closing bell, MCK had gained 16.5%.
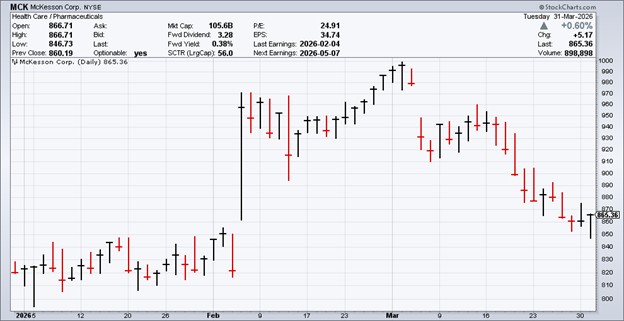
Source: StockCharts.com; from 01.01.2026 to 03.31.2026. Past performance is no guarantee of future returns.
Intercontinental Exchange (ICE) also had a positive reaction to its earnings report. ICE’s Q4 earnings rose to $1.71 per share. That beat by four cents per share. ICE’s quarterly revenue was up 8% to $2.5 billion, while operating margin reached 60%. The Exchanges division had an operating margin of 75%.
For the whole year, ICE’s earnings were up 14% to $6.95 per share, and revenue was up 7% to $9.9 billion. For 2025, ICE’S operating-cash flow was $4.7 billion, and adjusted free-cash flow was $4.2 billion.
Through Q4 of 2025, ICE bought back $1.3 billion in stock and paid out over $1.1 billion in dividends. ICE also raised its dividend by 8% to 52 cents per share.
Top Holdings
| Ticker | Security Description | Portfolio Weight % |
| FIX | COMFORT SYSTEMS USA INC | 6.22% |
| CASY | CASEY’S GENERAL STORES INC | 5.52% |
| IESC | IES HOLDINGS INC | 5.09% |
| ALSN | ALLISON TRANSMISSION HOLDING | 5.00% |
| MCK | MCKESSON CORP | 4.46% |
| AWK | AMERICAN WATER WORKS CO INC | 4.41% |
| SFM | SPROUTS FARMERS MARKET INC | 4.15% |
| HSIC | HENRY SCHEIN INC | 4.13% |
| ICE | INTERCONTINENTAL EXCHANGE INC | 4.12% |
| MLI | MUELLER INDUSTRIES INC | 4.02% |
As of 03.31.2026. Holdings subject to change.
Performance Review
The AdvisorShares Focused Equity ETF (CWS) held up well during a difficult market environment. For the quarter, the ETF’s Net Asset Value (NAV) lost 5.62%, while the traded shares fell 5.74%. For Q1, the S&P 500 Index lost 4.63%, and with dividends, the index lost 4.33%.
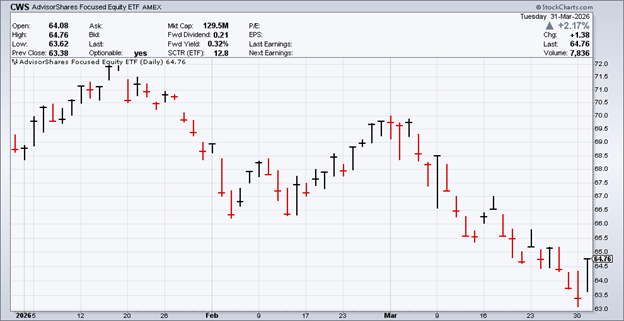
Source: StockCharts.com; from 01.01.2026 to 03.31.2026. Past performance is no guarantee of future returns.
Since the AdvisorShares Focused Equity ETF invests in many high-quality stocks, it has done well as investors get nervous.
As usual, the AdvisorShares Focused Equity ETF does no trading during the year. All 25 positions are in set stone as of December 31st, and we don’t make any changes for the next 12 months.
For Q1, the Dow Jones Industrial Average fell 3.58%, which made it the best performer of the three major indexes. The Nasdaq lost 7.11% for the quarter, and the S&P 500 lost 4.33%.
The Federal Reserve eased on rates late last year. This year, expectations for more cuts were put on hold. Inflation cooled, but the jobs market got noticeably weaker.
Outlook
Right now, Wall Street is heavily focused on the events in the Middle East. A successful operation could lead to lower oil prices and a surge of optimism through the economy. If hostilities continue much longer, that could lead to higher commodity prices.
Investors also must contend with a weakening jobs market. This hasn’t hit corporate profits just yet, but that may change in a few months. Also, the housing market is not very strong and may already be in a recession.
I don’t want to sound too pessimistic. The AdvisorShares Focused Equity ETF seeks to do well in any environment. I believe, we have a lot of high-quality stocks, and very few of our stocks are overpriced. I’m looking forward to a bright 2026.
![]() Respectfully,
Respectfully,
Eddy Elfenbein
Crossing Wall Street
AdvisorShares Focused Equity ETF (CWS) Portfolio Strategist
Management Fee
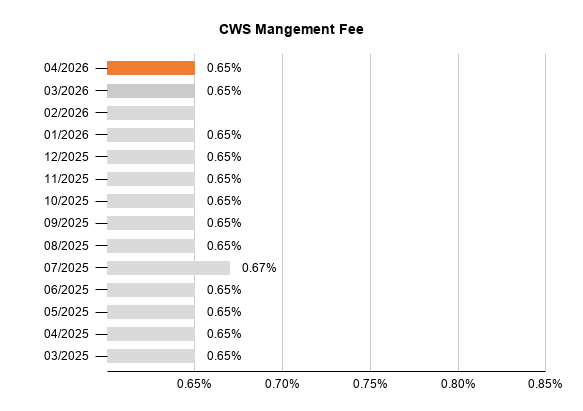
In a first for the ETF industry, the portfolio strategist of CWS has “skin in the game.” The strategist’s compensation is directly tied to portfolio’s performance. Using the trailing 12-month returns of CWS vs. its S&P 500 Index benchmark, stronger outperformance is rewarded with a larger management fee while weaker underperformance is penalized with a smaller management fee.
After the Fund’s March performance, the CWS fulcrum fee will be 0.65% in April 2026.
Past Commentary
A basis point is one hundredth of a percentage point (0.01%).
The S&P 500 Index is a broad-based, unmanaged measurement of changes in stock market conditions based on the average of 500 widely held common stocks. One cannot invest directly in an index.
Before investing you should carefully consider the Fund’s investment objectives, risks, charges and expenses. This and other information is in the prospectus or summary prospectus, a copy of which may be obtained by visiting www.advisorshares.com. Please read the prospectus carefully before you invest. Foreside Fund Services, LLC, distributor.
There is no guarantee that the Fund will achieve its investment objective. An investment in the Fund is subject to risk, including the possible loss of principal amount invested. The prices of equity securities rise and fall daily. These price movements may result from factors affecting individual issuers, industries or the stock market as a whole. Shares of the Fund may trade above or below their net asset value (“NAV”). The trading price of the Fund’s shares may deviate significantly from their NAV during periods of market volatility. There can be no assurance that an active trading market for the Fund’s shares will develop or be maintained. In addition, equity markets tend to move in cycles which may cause stock prices to fall over short or extended periods of time. Other Fund risks include market risk, liquidity risk, large cap, mid cap, and small cap risk. Please see prospectus for details regarding risk.
Shares are bought and sold at market price (closing price) not NAV and are not individually redeemed from the Fund. Market price returns are based on the midpoint of the bid/ask spread at 4:00 pm Eastern Time (when NAV is normally determined), and do not represent the return you would receive if you traded at other times.
Holdings and allocations are subject to risks and to change.
The views in this commentary are those of the portfolio manager and may not reflect his views on the date this material is distributed or anytime thereafter. These views are intended to assist shareholders in understanding their investments and do not constitute investment advice.