
NAV as of 7/21/2026
$148.40
1 Day NAV Change as of 7/21/2026
$0.65
Overall Morningstar Rating
Mid-Cap Blend
Based on risk-adjusted return out of 365 funds in the Mid-Cap Blend Overall Rating category as of June 30th, 2026.
4-Star
Morningstar Rated
Overall Morningstar Rating. Mid-Cap Blend. Based on risk-adjusted return out of 365 funds in the Mid-Cap Blend category as of June 30th, 2026.
| Symbol | Exchange | Inception Date | CUSIP | NAV | Options Available |
|---|---|---|---|---|---|
| SURE | NYSE Arca | 10/4/2011 | 00768Y818 | SURE.NV | Yes |
About the ETF
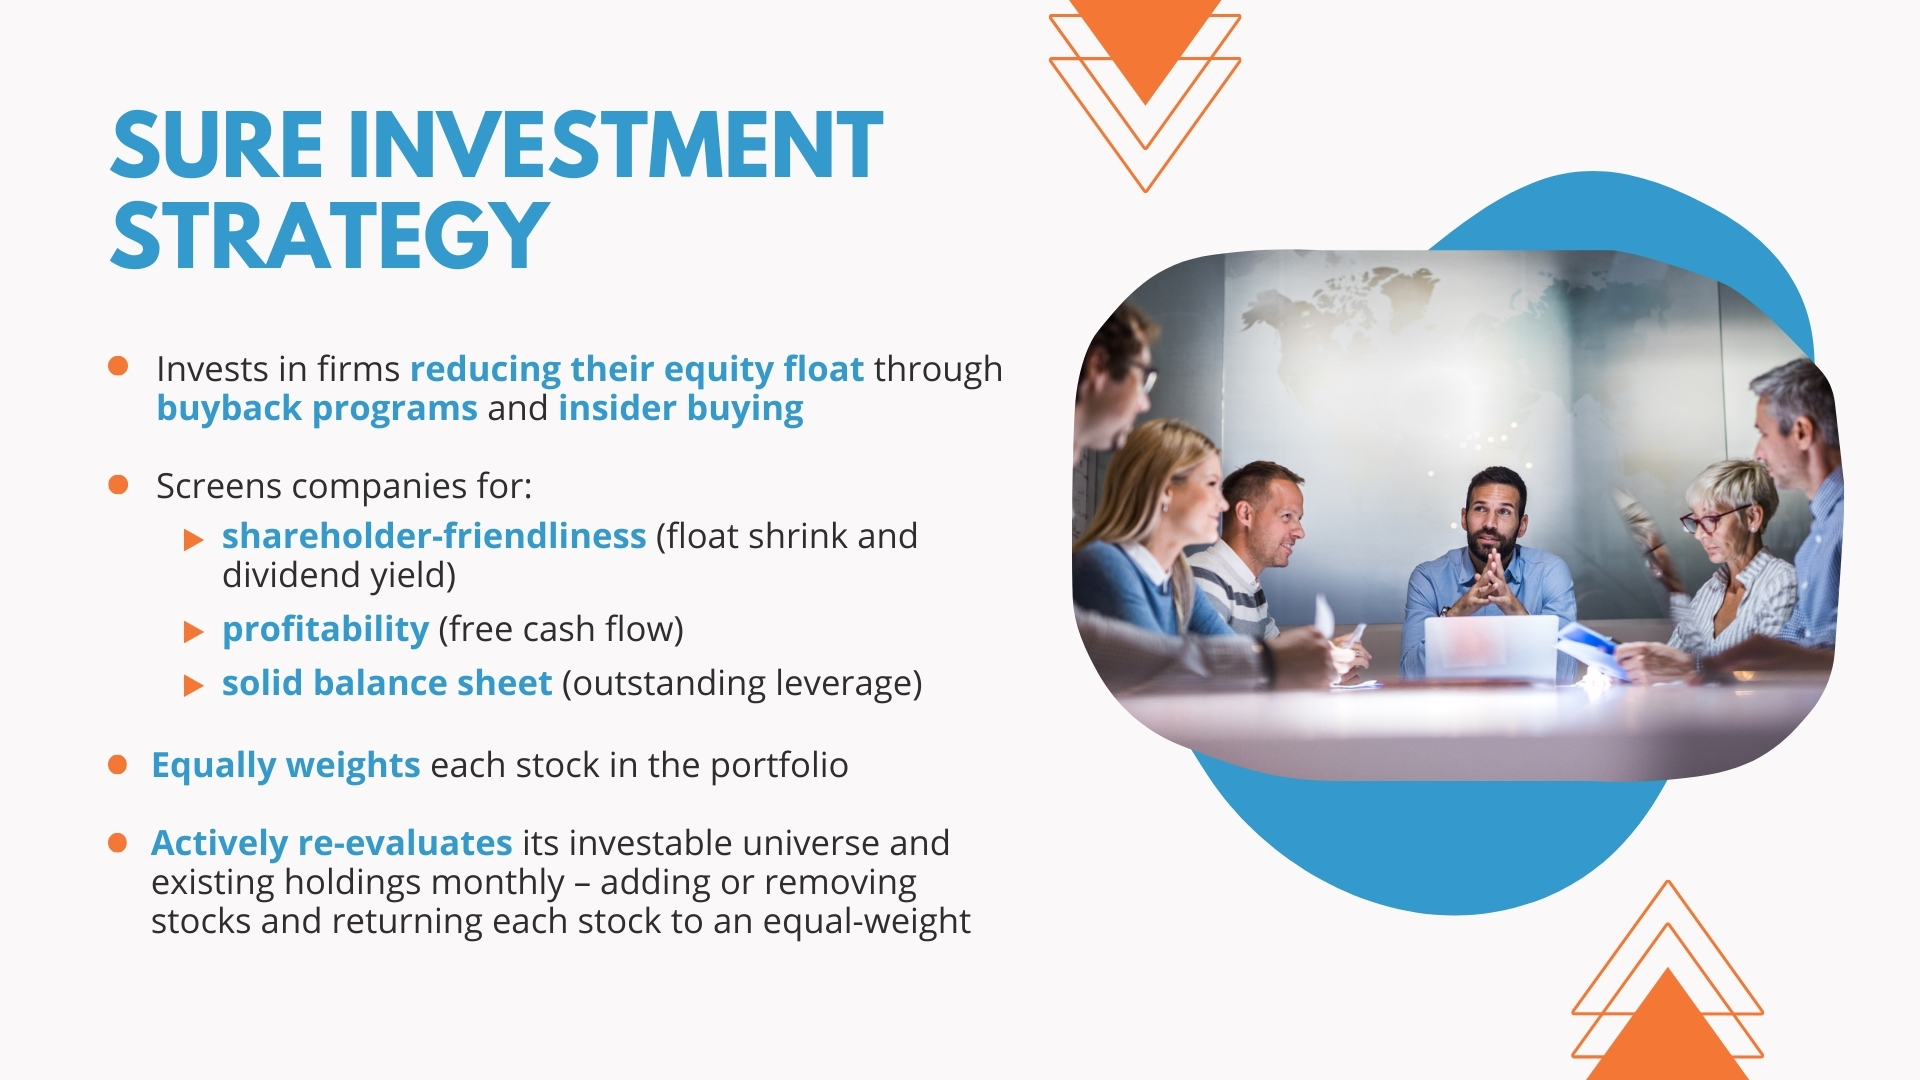
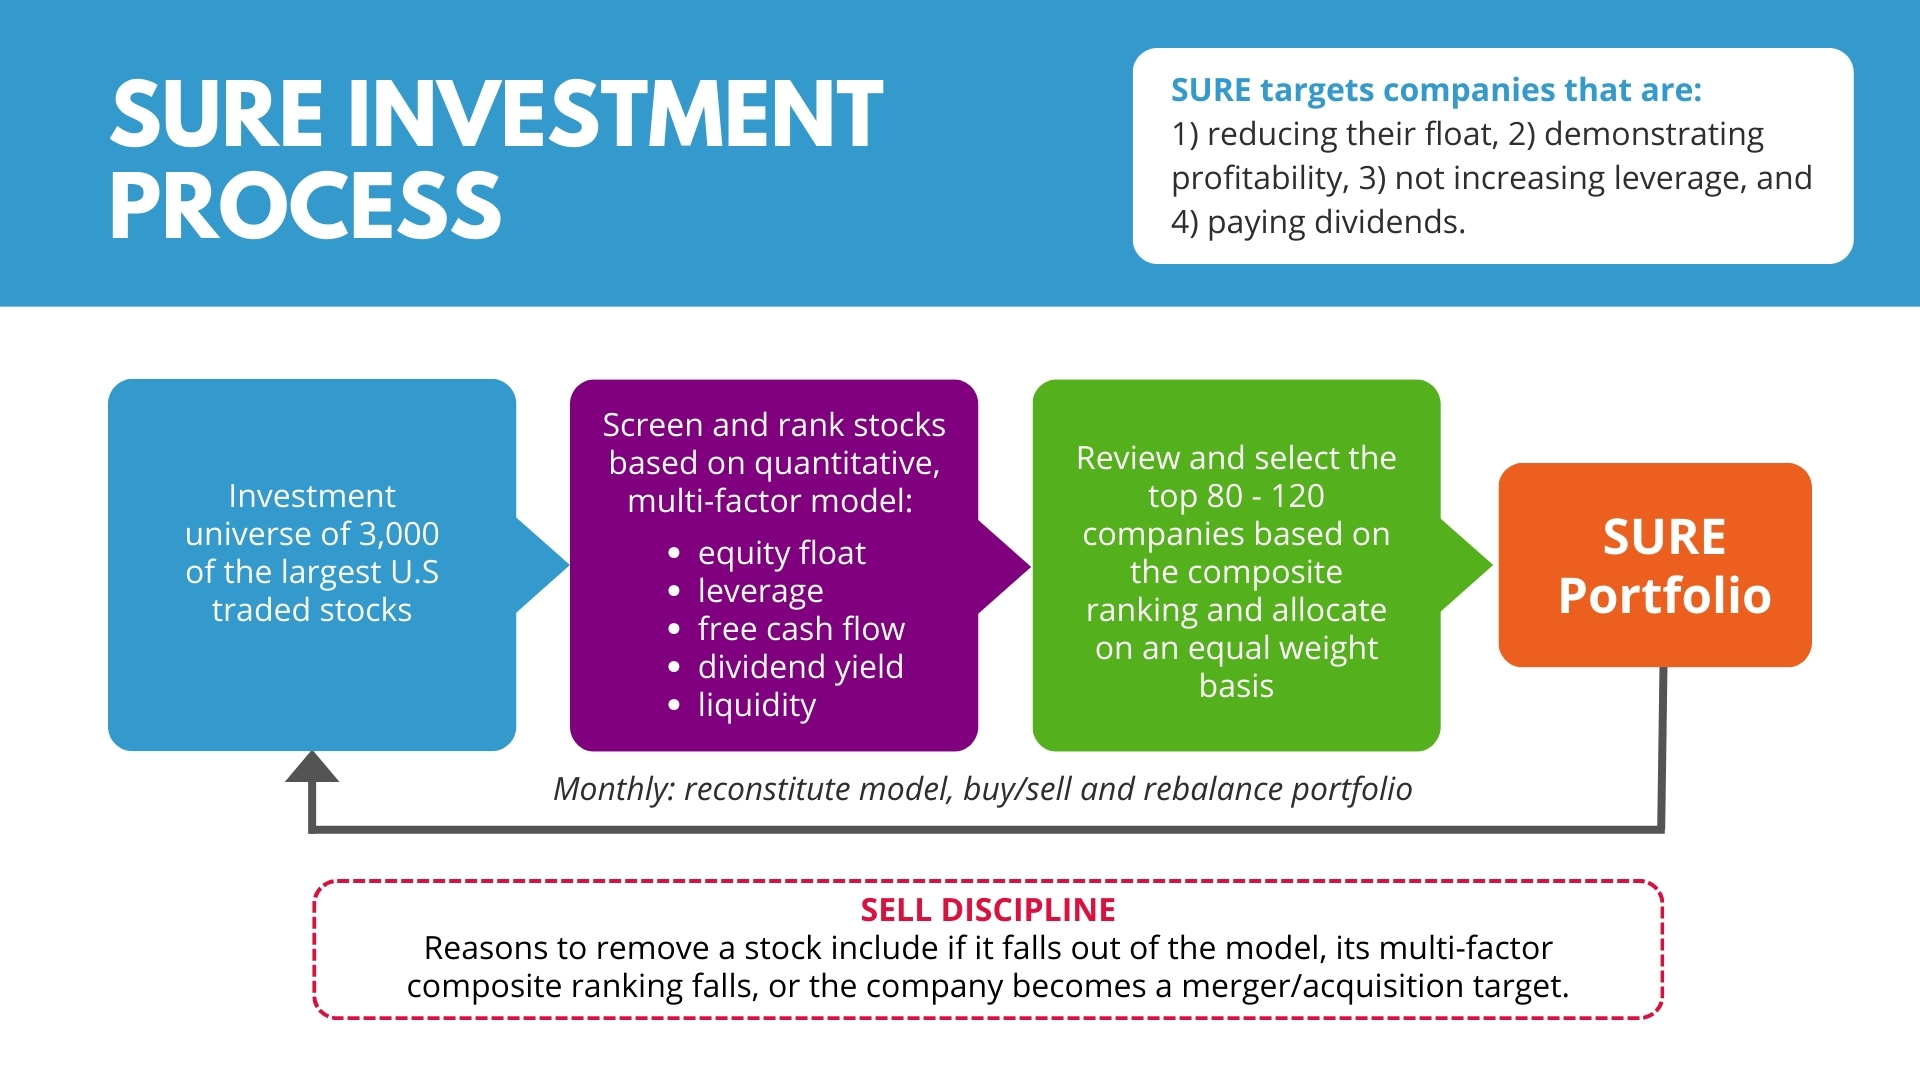
Following a core investment philosophy that corporate insiders know their companies the best, the AdvisorShares Insider Advantage ETF (SURE) seeks to invest in the equities of companies actively trying to reduce their public equity float through well-executed stock buyback programs and corporate insider buying. Not only do buybacks and insider buying demonstrate that executives may see relative value in the firm’s stock, they also could create favorable shareholder market conditions through the reduction of publicly available shares (float shrink). SURE selects holdings using an active, quantitative, multi-factor model to identify companies shrinking float, lowering leverage, growing free cash flow, and providing dividends. SURE’s holdings are equal-weighted and reconstituted/rebalanced monthly.
What Is Float Shrink?
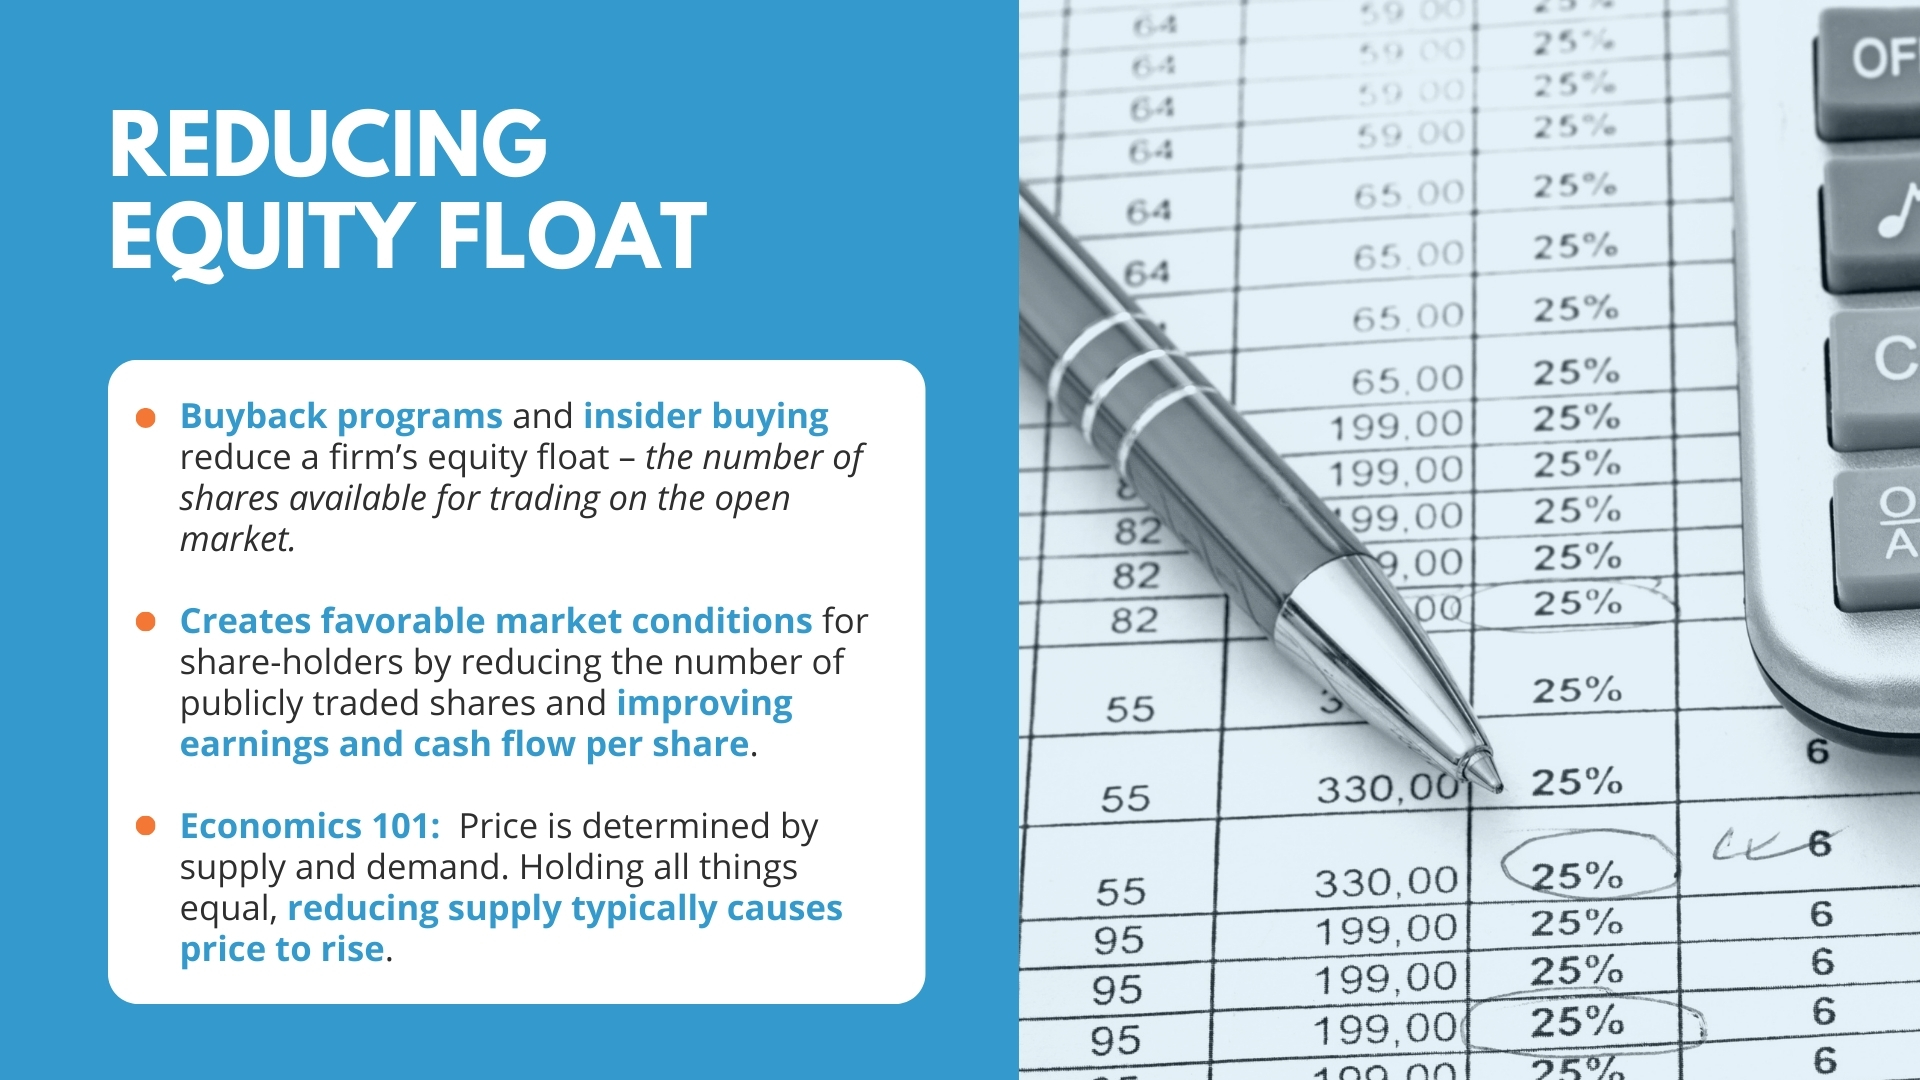
Public equity float refers to the portion of a company’s outstanding shares that is in the hands of public investors – as opposed to company officers, directors, or stockholders that hold controlling interests – and are available for trading in the open market. The float is calculated by subtracting restricted shares from outstanding shares. Float shrink occurs when there is a reduction of publicly available shares.
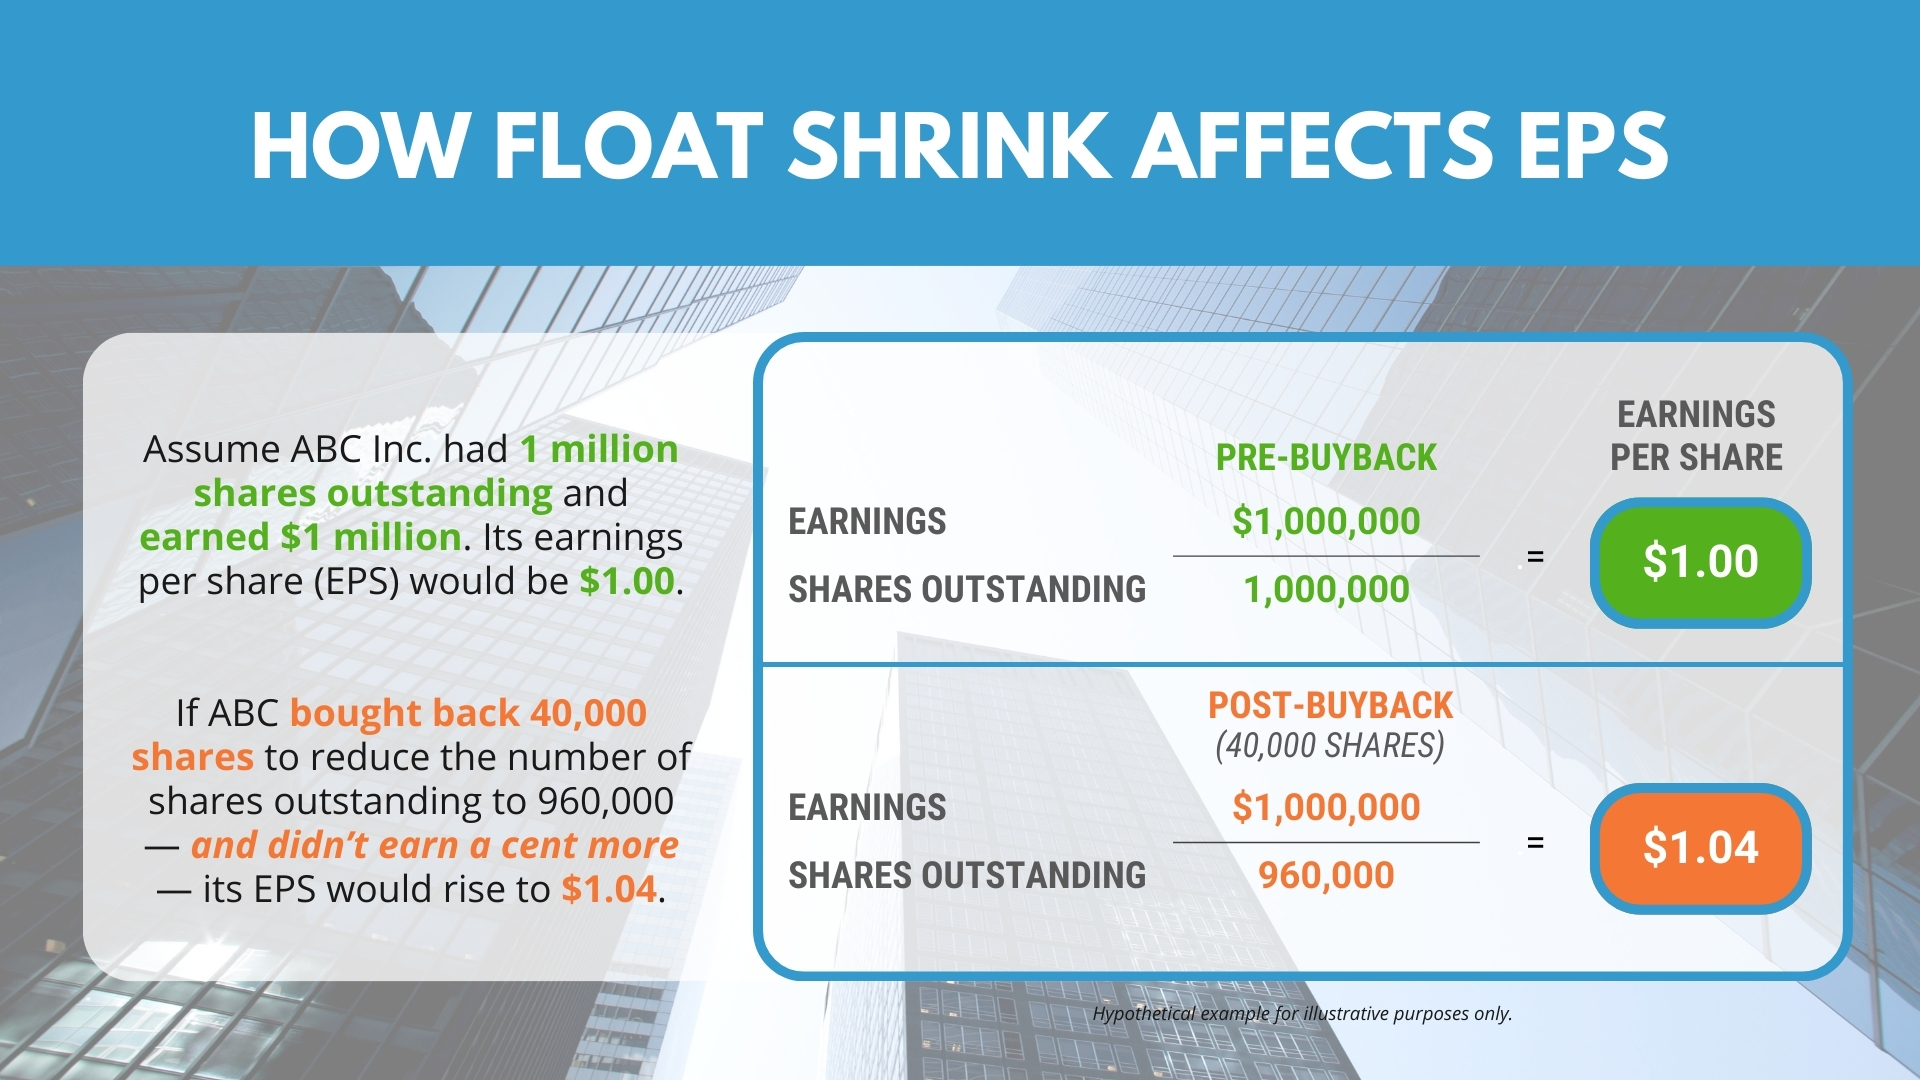
Buybacks – action taken by a corporation to repurchase its own shares from the marketplace – are the most common cause of float shrink today and one of two ways a company can distribute profits to shareholders. Dividend payments are the second form. While firms may implement both, since 1997, share buybacks have surpassed cash dividends to become the dominant form of corporate payout in the U.S. Not only do buybacks avoid a stock price penalty if a firm cuts or ends a program, like dividends are subject to, but also provide a positive market impact by improving earnings and cash flow per share.
Insider buying – the purchase of shares in a corporation by a board member, officer, or executive within that company (i.e., corporate insider) – is another way that float shrink occurs. It may be a strong indicator that insiders are becoming more optimistic about the company’s future. Buying by corporate insiders is legal, highly regulated, publicly disclosed, and different from “insider trading” – the illegal act of buying or selling stock by someone who has privileged, non-public information about a company.
Why Invest?
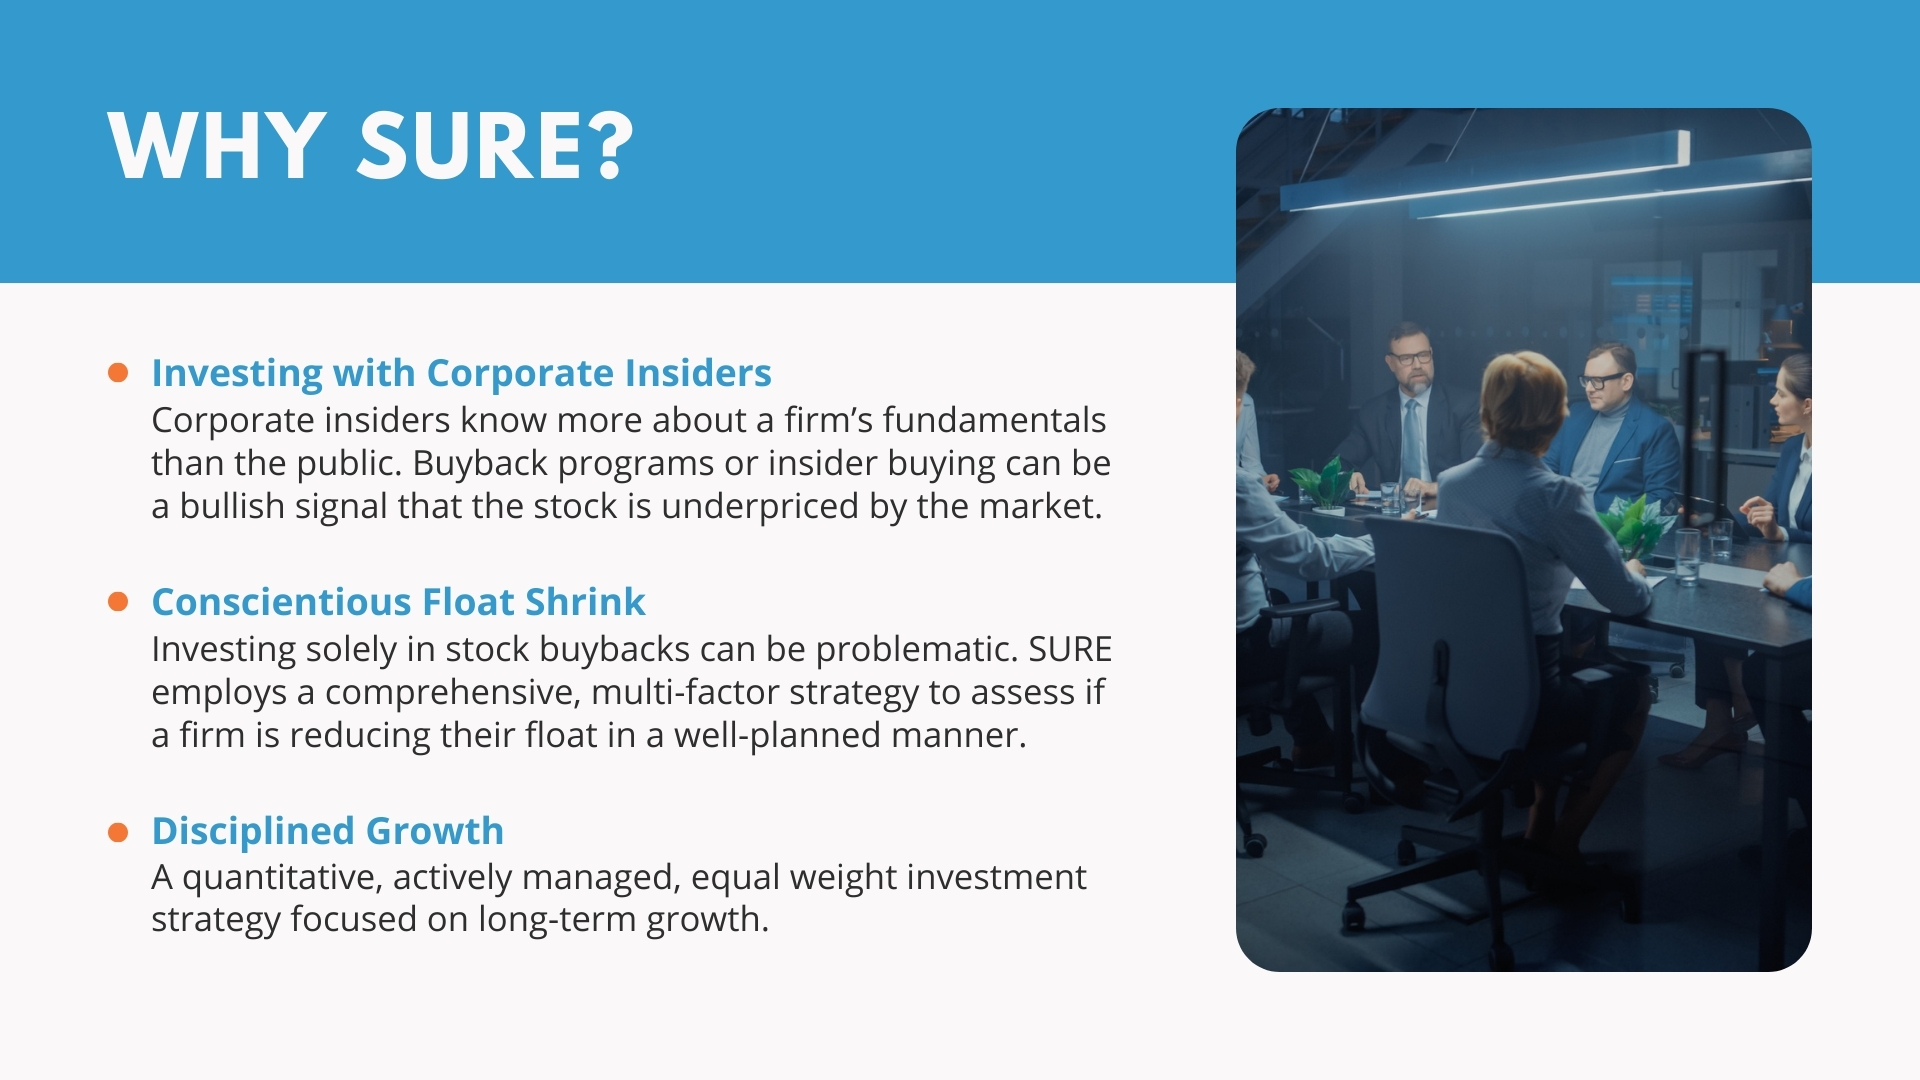
- Investing with Corporate Insiders – Top firm executives know more about the company’s fundamentals than the investing public. These insiders can influence their company’s share price by timing equity issuance and repurchase to the firm’s advantage. A well-implemented buyback program reduces publicly available shares and can increase the stock’s price. Additionally, corporate insider buying can be a bullish signal that the stock is underpriced by the market.
- Conscientious Float Shrink – Investing solely in stock buybacks can be problematic. SURE employs a comprehensive, multi-factor strategy to assess if a firm is reducing their float in a well-planned manner, analyzing free cash flow, profitability, leverage reduction, dividend yield, net buybacks and insider buying.
- Disciplined Growth – A quantitative, actively managed, equal weight investment strategy focused on long-term growth.
Key Attributes
- Float Shrink – Corporate insiders have better information than the investing public and know their companies the best. Stock buyback programs and insider buying not only show that corporate insiders see relative value in investing in their own equity securities, but also create favorable market conditions for shareholders by reducing the number of publicly traded shares and improving earnings and cash flow per share.
- Extensive Stock Screening – SURE’s portfolio manager screens approximately 3,000 companies and looks for the following characteristics when selecting stocks: shareholder-friendliness (measured by float shrink and dividend yield), profitability (measured by free cash flow), solid balance sheet (measured by outstanding leverage).
- Equal Weight Investing – In a market-cap weighted portfolio, a small number of the largest companies receive the heaviest allocations and overvalued components are overweighted relative to undervalued components. By contrast, with an equal weight strategy, the bias to the largest companies is removed; a buy low, sell high discipline is regularly followed with periodic rebalancing; and reallocation to undervalued stocks may provide the opportunity to capture long-term equity performance.
- Actively Managed ETF Structure – SURE is different from other buyback-focused investments that follow passive, market-cap weighted indexes and only reconstitute annually. SURE re-evaluates its investable universe and existing holdings monthly – adding or removing stocks and returning each security to an equal-weight allocation – allowing SURE to react more quickly to changes in buyback programs, acquisition announcements, etc. An ETF structure allows for better tax efficiency than mutual funds or than investing in the underlying stocks directly.
Where Can SURE Fit in a Traditional Portfolio?
SURE can serve as a thematic investment or a complement to a dividend investing or market-cap weighted core strategy.
About the Portfolio Strategist
Minyi Chen, Portfolio Strategist
Minyi Chen, CFA is the founder and CEO of Qubed Capital, a registered investment advisor founded in 2015 and based in Oakland, California. For over a decade, Mr. Chen has been providing quantitative financial research and analysis along with proprietary investment models to both retail and institutional investors. In the past, Mr. Chen has served as a portfolio manager of the AdvisorShares TrimTabs Float Shrink ETF (ticker: TTFS) and the TrimTabs International Free-Cash-Flow ETF (ticker: FCFI).


Click on the above slides to expand the slide view.
SURE Overview
Get a quick and easy introduction to the SURE ETF.
SURE Overview
Get a quick and easy introduction to the SURE ETF.
Fund
Price History
Fund Data
7/21/2026| NAV | $148.40 |
| Change | $0.65 |
| Shares Outstanding | 380,000 |
| Assets Under Management | $56,390,501.34 |
Market Data
7/21/2026| Closing Price | $148.32 |
| Close Change | $0.65 |
| Volume | 19 |
Regulatory Data
7/21/2026| Premium Discount | $-0.05 |
| 30-Day Median bid-ask Spread | 0.364668 |
Shares are bought and sold at market price (closing price) not NAV and are not individually redeemed from the Fund. Market price returns are based on the midpoint of the bid/ask spread at 4:00 pm Eastern Time (when NAV is normally determined), and do not represent the return you would receive if you traded at other times.
")
FUND
Characteristics
As of 6/30/2026
Source: Morningstar & AdvisorShares
FUND
Performance
As of 6/30/2026
| NAV | Market Price Return | Russell 3000 Index | |
|---|---|---|---|
| 1 Month | 5.45 | 5.44 | -0.30 |
| 3 Months | 16.94 | 17.09 | 15.44 |
| YTD | 16.90 | 16.85 | 10.88 |
| 1 Year | 28.04 | 27.92 | 22.82 |
| 3 Years | 17.12 | 17.11 | 20.36 |
| 5 Years | 10.49 | 10.52 | 12.31 |
| 10 Years | 11.57 | 11.57 | 15.06 |
| Since Inception (10/04/2011, Annualized) | 13.55 | 13.55 | 15.50 |
As of 6/30/2026
| NAV | Market Price Return | Russell 3000 Index | |
|---|---|---|---|
| 1 Month | 5.45 | 5.44 | -0.30 |
| 3 Months | 16.94 | 17.09 | 15.44 |
| YTD | 16.90 | 16.85 | 10.88 |
| 1 Year | 28.04 | 27.92 | 22.82 |
| 3 Year | 17.12 | 17.11 | 20.36 |
| Since 9/1/2022, Annualized | 16.41 | 16.50 | 19.35 |
Performance data quoted represents past performance and is no guarantee of future results. All Fund data and performance data quoted is believed to be accurate, and unless otherwise stated, is sourced from the Fund administrator, the Advisor’s or Sub-Advisor’s proprietary data, and Morningstar. Current performance may be lower or higher than the performance data quoted. Investment return and principal value will fluctuate so that an investor’s shares, when redeemed, may be worth more or less than original cost. Returns less than one year are not annualized.
*On September 1, 2022, the AdvisorShares DoubleLine Value Equity ETF (the “Predecessor Fund”) was renamed the AdvisorShares Insider Advantage ETF. The Predecessor Fund had different portfolio managers and investment strategy than the AdvisorShares Insider Advantage ETF. Performance prior to September 1, 2022 reflects the Fund’s performance prior to the change in manager and investment strategy and may not be indicative of the Fund’s performance under the new manager and revised investment strategy. Performance since September 1, 2022 reflects actual AdvisorShares Insider Advantage ETF performance.
Performance data quoted represents past performance and is no guarantee of future results. All Fund data and performance data quoted is believed to be accurate, and unless otherwise stated, is sourced from the Fund administrator, the Advisor’s or Sub-Advisor’s proprietary data, and Morningstar. Current performance may be lower or higher than the performance data quoted. Investment return and principal value will fluctuate so that an investor’s shares, when redeemed, may be worth more or less than original cost. Returns less than one year are not annualized. One cannot invest directly in an index. The Russell 1000 Index represents the top 1000 companies by market capitalization in the United States. The index is a subset of the Russell 3000 Index. The Russell 3000 Index is broad market, capitalization-weighted index comprised of the largest 3,000 U.S. companies and represents 98% of the investable U.S. equity market.
Get Social @AdvisorShares
Join the conversation on social media to hear more from the portfolio manager, get informed about upcoming events and webinars, and more!
Fund
Holdings
As of
| Date | Account Symbol | Stock Ticker | Security ID | Security Description | Shares | Share Price | Market Value | Portfolio Weight | Asset Group |
|---|---|---|---|---|---|---|---|---|---|
| 07/21/2026 | SURE | SEZL | 78435P105 | SEZZLE INC | 6,460 | 179.35 | 1,158,601.00 | 2.05% | S |
| DVA | 23918K108 | DAVITA INC | 4,270 | 237.28 | 1,013,185.60 | 1.80% | S | ||
| FTNT | 34959E109 | FORTINET INC | 6,000 | 158.10 | 948,600.00 | 1.68% | S | ||
| KFRC | 493732101 | KFORCE INC | 16,160 | 57.47 | 928,715.20 | 1.65% | S | ||
| AMAT | 038222105 | APPLIED MATERIALS INC | 1,562 | 564.55 | 881,827.10 | 1.56% | S | ||
| EVER | 30041R108 | EVERQUOTE INC - CLASS A | 32,500 | 26.92 | 874,900.00 | 1.55% | S | ||
| MRVL | 573874104 | MARVELL TECHNOLOGY INC | 3,960 | 207.96 | 823,521.60 | 1.46% | S | ||
| DAVE | 23834J201 | DAVE INC | 1,870 | 438.90 | 820,743.00 | 1.46% | S | ||
| IRDM | 46269C102 | IRIDIUM COMMUNICATIONS INC | 16,296 | 47.24 | 769,823.04 | 1.37% | S | ||
| CROX | 227046109 | CROCS INC | 5,600 | 135.28 | 757,568.00 | 1.34% | S | ||
| MPC | 56585A102 | MARATHON PETROLEUM CORP | 2,350 | 319.76 | 751,436.00 | 1.33% | S | ||
| MUSA | 626755102 | MURPHY USA INC | 1,201 | 611.10 | 733,931.10 | 1.30% | S | ||
| LRCX | 512807306 | LAM RESEARCH CORP | 2,263 | 322.00 | 728,686.00 | 1.29% | S | ||
| PAYO | 70451X104 | PAYONEER GLOBAL INC | 101,200 | 7.12 | 720,544.00 | 1.28% | S | ||
| AIN | 012348108 | ALBANY INTL CORP-CL A | 9,400 | 75.91 | 713,554.00 | 1.27% | S | ||
| AMPL | 03213A104 | AMPLITUDE INC-CLASS A | 72,300 | 9.59 | 693,357.00 | 1.23% | S | ||
| ENVA | 29357K103 | ENOVA INTERNATIONAL INC | 3,000 | 228.46 | 685,380.00 | 1.22% | S | ||
| CAT | 149123101 | CATERPILLAR INC | 741 | 889.97 | 659,467.77 | 1.17% | S | ||
| FRSH | 358054104 | FRESHWORKS INC-CL A | 61,000 | 10.69 | 652,090.00 | 1.16% | S | ||
| KOP | 50060P106 | KOPPERS HOLDINGS INC | 12,600 | 51.47 | 648,522.00 | 1.15% | S | ||
| EXEL | 30161Q104 | EXELIXIS INC | 11,400 | 56.12 | 639,768.00 | 1.13% | S | ||
| STGW | 85256A109 | STAGWELL INC | 87,700 | 7.25 | 635,825.00 | 1.13% | S | ||
| ELV | 036752103 | ELEVANCE HEALTH INC | 1,600 | 393.44 | 629,504.00 | 1.12% | S | ||
| VLO | 91913Y100 | VALERO ENERGY CORP | 1,980 | 314.80 | 623,304.00 | 1.11% | S | ||
| QCOM | 747525103 | QUALCOMM INC | 3,589 | 173.50 | 622,691.50 | 1.10% | S | ||
| KLAC | 482480100 | KLA CORP | 2,860 | 217.56 | 622,221.60 | 1.10% | S | ||
| BFH | 018581108 | BREAD FINANCIAL HOLDINGS INC | 6,000 | 101.68 | 610,080.00 | 1.08% | S | ||
| MCRI | 609027107 | MONARCH CASINO & RESORT INC | 5,168 | 117.45 | 606,981.60 | 1.08% | S | ||
| CTS | 126501105 | CTS CORP | 9,900 | 61.31 | 606,969.00 | 1.08% | S | ||
| ECPG | 292554102 | ENCORE CAPITAL GROUP INC | 6,750 | 89.20 | 602,100.00 | 1.07% | S | ||
| ODFL | 679580100 | OLD DOMINION FREIGHT LINE | 2,538 | 234.79 | 595,897.02 | 1.06% | S | ||
| FLNG | G35947202 | FLEX LNG LTD | 18,700 | 31.30 | 585,310.00 | 1.04% | FS | ||
| MTCH | 57667L107 | MATCH GROUP INC | 15,100 | 38.75 | 585,125.00 | 1.04% | S | ||
| ON | 682189105 | ON SEMICONDUCTOR | 6,400 | 91.06 | 582,784.00 | 1.03% | S | ||
| URI | 911363109 | UNITED RENTALS INC | 574 | 1,013.54 | 581,771.96 | 1.03% | S | ||
| EXPD | 302130109 | EXPEDITORS INTL WASH INC | 3,240 | 178.58 | 578,599.20 | 1.03% | S | ||
| AAPL | 037833100 | APPLE INC | 1,763 | 327.74 | 577,805.62 | 1.02% | S | ||
| SEIC | 784117103 | SEI INVESTMENTS COMPANY | 5,871 | 97.65 | 573,303.15 | 1.02% | S | ||
| ALSN | 01973R101 | ALLISON TRANSMISSION HOLDING | 4,875 | 116.21 | 566,523.75 | 1.00% | S | ||
| NVDA | 67066G104 | NVIDIA CORP | 2,730 | 207.29 | 565,901.70 | 1.00% | S | ||
| GSHD | 38267D109 | GOOSEHEAD INSURANCE INC -A | 10,500 | 53.75 | 564,375.00 | 1.00% | S | ||
| DBX | 26210C104 | DROPBOX INC-CLASS A | 19,000 | 29.42 | 558,980.00 | 0.99% | S | ||
| TRS | 896215209 | TRIMAS CORP | 13,750 | 40.53 | 557,287.50 | 0.99% | S | ||
| XOM | 30233Q108 | EXXONMOBIL HOLDINGS CORP | 3,638 | 151.71 | 551,920.98 | 0.98% | S | ||
| V | 92826C839 | VISA INC-CLASS A SHARES | 1,550 | 355.82 | 551,521.00 | 0.98% | S | ||
| RNR | G7496G103 | RENAISSANCERE HOLDINGS LTD | 1,709 | 321.18 | 548,896.62 | 0.97% | FS | ||
| SAIC | 808625107 | SCIENCE APPLICATIONS INTE | 4,900 | 111.82 | 547,918.00 | 0.97% | S | ||
| HGV | 43283X105 | HILTON GRAND VACATIONS INC | 11,000 | 49.19 | 541,090.00 | 0.96% | S | ||
| HLT | 43300A203 | HILTON WORLDWIDE HOLDINGS IN | 1,658 | 323.94 | 537,092.52 | 0.95% | S | ||
| PH | 701094104 | PARKER HANNIFIN CORP | 556 | 959.58 | 533,526.48 | 0.95% | S | ||
| TPR | 876030107 | TAPESTRY INC | 3,750 | 142.16 | 533,100.00 | 0.95% | S | ||
| GOOG | 02079K107 | ALPHABET INC-CL C | 1,536 | 346.19 | 531,747.84 | 0.94% | S | ||
| ITW | 452308109 | ILLINOIS TOOL WORKS | 1,941 | 271.99 | 527,932.59 | 0.94% | S | ||
| FTI | G87110105 | TECHNIPFMC PLC | 7,051 | 74.62 | 526,145.62 | 0.93% | FS | ||
| TOL | 889478103 | TOLL BROTHERS INC | 3,560 | 147.20 | 524,032.00 | 0.93% | S | ||
| TXT | 883203101 | TEXTRON INC | 5,700 | 90.53 | 516,021.00 | 0.92% | S | ||
| EVTC | 30040P103 | EVERTEC INC | 17,100 | 30.02 | 513,342.00 | 0.91% | FS | ||
| ABNB | 009066101 | AIRBNB INC-CLASS A | 3,550 | 144.10 | 511,555.00 | 0.91% | S | ||
| MCO | 615369105 | MOODY'S CORP | 1,040 | 490.77 | 510,400.80 | 0.91% | S | ||
| SWX | 844895102 | SOUTHWEST GAS HOLDINGS INC | 5,530 | 92.22 | 509,976.60 | 0.90% | S | ||
| PHM | 745867101 | PULTEGROUP INC | 3,972 | 124.26 | 493,560.72 | 0.88% | S | ||
| COP | 20825C104 | CONOCOPHILLIPS | 4,185 | 117.50 | 491,737.50 | 0.87% | S | ||
| WH | 98311A105 | WYNDHAM HOTELS & RESORTS INC | 6,406 | 75.72 | 485,062.32 | 0.86% | S | ||
| CSL | 142339100 | CARLISLE COS INC | 1,500 | 322.61 | 483,915.00 | 0.86% | S | ||
| COKE | 191098102 | COCA-COLA CONSOLIDATED INC | 2,640 | 183.09 | 483,357.60 | 0.86% | S | ||
| HIG | 416515104 | HARTFORD INSURANCE GROUP INC | 3,397 | 141.98 | 482,306.06 | 0.86% | S | ||
| ESNT | G3198U102 | ESSENT GROUP LTD | 7,316 | 65.48 | 479,051.68 | 0.85% | FS | ||
| DHI | 23331A109 | DR HORTON INC | 3,336 | 143.52 | 478,782.72 | 0.85% | S | ||
| CARG | 141788109 | CARGURUS INC | 13,600 | 35.06 | 476,816.00 | 0.85% | S | ||
| NYT | 650111107 | NEW YORK TIMES CO-A | 6,340 | 74.69 | 473,534.60 | 0.84% | S | ||
| MSFT | 594918104 | MICROSOFT CORP | 1,184 | 397.75 | 470,936.00 | 0.84% | S | ||
| MSCI | 55354G100 | MSCI INC | 830 | 561.74 | 466,244.20 | 0.83% | S | ||
| ORLY | 67103H107 | O'REILLY AUTOMOTIVE INC | 5,300 | 87.97 | 466,241.00 | 0.83% | S | ||
| FLS | 34354P105 | FLOWSERVE CORP | 6,900 | 67.52 | 465,888.00 | 0.83% | S | ||
| FCNCA | 31946M103 | FIRST CITIZENS BCSHS -CL A | 223 | 2,071.16 | 461,868.68 | 0.82% | S | ||
| MORN | 617700109 | MORNINGSTAR INC | 2,720 | 165.70 | 450,704.00 | 0.80% | S | ||
| DVN | 25179M103 | DEVON ENERGY CORP | 10,181 | 44.10 | 448,982.10 | 0.80% | S | ||
| VAL | G9460G101 | VALARIS LTD | 5,740 | 78.08 | 448,179.20 | 0.79% | FS | ||
| BKNG | 09857L108 | BOOKING HOLDINGS INC | 2,475 | 179.40 | 444,015.00 | 0.79% | S | ||
| CVX | 166764100 | CHEVRON CORP | 2,320 | 191.07 | 443,282.40 | 0.79% | S | ||
| UPWK | 91688F104 | UPWORK INC | 48,000 | 9.19 | 441,120.00 | 0.78% | S | ||
| CNX | 12653C108 | CNX RESOURCES CORP | 13,000 | 33.64 | 437,320.00 | 0.78% | S | ||
| CMG | 169656105 | CHIPOTLE MEXICAN GRILL INC | 13,000 | 33.32 | 433,160.00 | 0.77% | S | ||
| ADBE | 00724F101 | ADOBE INC | 1,900 | 227.16 | 431,604.00 | 0.77% | S | ||
| JBGS | 46590V100 | JBG SMITH PROPERTIES | 29,700 | 14.49 | 430,353.00 | 0.76% | S | ||
| ASTS | 00217D100 | AST SPACEMOBILE INC | 6,750 | 63.34 | 427,545.00 | 0.76% | S | ||
| CHDN | 171484108 | CHURCHILL DOWNS INC | 5,080 | 83.33 | 423,316.40 | 0.75% | S | ||
| AOS | 831865209 | SMITH (A.O.) CORP | 7,138 | 58.76 | 419,428.88 | 0.74% | S | ||
| CRM | 79466L302 | SALESFORCE INC | 2,430 | 170.06 | 413,245.80 | 0.73% | S | ||
| VRSK | 92345Y106 | VERISK ANALYTICS INC | 2,115 | 195.25 | 412,953.75 | 0.73% | S | ||
| TKO | 87256C101 | TKO GROUP HOLDINGS INC | 2,250 | 181.70 | 408,825.00 | 0.73% | S | ||
| LMT | 539830109 | LOCKHEED MARTIN CORP | 800 | 507.09 | 405,672.00 | 0.72% | S | ||
| VNT | 928881101 | VONTIER CORP | 13,155 | 30.23 | 397,675.65 | 0.71% | S | ||
| NFLX | 64110L106 | NETFLIX INC | 5,600 | 68.67 | 384,552.00 | 0.68% | S | ||
| OKLO | 02156V109 | OKLO INC | 8,680 | 44.13 | 383,048.40 | 0.68% | S | ||
| HCA | 40412C101 | HCA HEALTHCARE INC | 1,022 | 373.09 | 381,297.98 | 0.68% | S | ||
| DPZ | 25754A201 | DOMINO'S PIZZA INC | 1,150 | 326.34 | 375,291.00 | 0.67% | S | ||
| ADSK | 052769106 | AUTODESK INC | 1,750 | 211.15 | 369,512.50 | 0.66% | S | ||
| UHS | 913903100 | UNIVERSAL HEALTH SERVICES-B | 2,450 | 149.91 | 367,279.50 | 0.65% | S | ||
| BAH | 099502106 | BOOZ ALLEN HAMILTON HOLDINGS | 5,650 | 63.85 | 360,752.50 | 0.64% | S | ||
| CASH | 152,288.31 | 100.00 | 152,288.31 | 0.27% | CA | ||||
| X9USDBLYT | BLACKROCK TREASURY TRUST INSTL 62 | 84,632.65 | 1.00 | 84,632.65 | 0.15% | MM |
FUND
Fees & Expenses
Annual Fund Operating Expenses (expenses that you pay each year as a percentage of the value of your investment)
| Management Fee | 0.70% | |
| Other Expenses | 0.30% | |
| Gross Expense Ratio | 1.00% | |
| Fee Waiver/Expense Reimbursement* | -0.10% | |
| Net Expense Ratio | 0.90% |
| Expense Cap Limitation* | 0.90% |
*The Advisor has contractually agreed to keep net expenses from exceeding 0.90% of the Fund’s average daily net assets for at least one year from the date of the prospectus. For more information, please read the full prospectus.
Last Ten
Fund Distributions
")
The Morningstar Rating™ for funds, or “star rating,” is calculated for managed products (including mutual funds, variable annuity and variable life subaccounts, exchange-traded funds, closed-end funds, and separate accounts) with at least a three-year history. Exchange-traded funds and open-ended mutual funds are considered a single population for comparative purposes. It is calculated based on a Morningstar Risk-Adjusted Return measure that accounts for variation in a managed product’s monthly excess performance, placing more emphasis on downward variations and rewarding consistent performance. The top 10% of products in each product category receive 5 stars, the next 22.5% receive 4 stars, the next 35% receive 3 stars, the next 22.5% receive 2 stars, and the bottom 10% receive 1 star. The Overall Morningstar Rating for a managed product is derived from a weighted average of the performance figures associated with its three-, five-, and 10-year (if applicable) Morningstar Rating metrics. The weights are: 100% three-year rating for 36-59 months of total returns, 60% five-year rating/40% three-year rating for 60-119 months of total returns, and 50% 10-year rating/30% five-year rating/20% three-year rating for 120 or more months of total returns. While the 10-year overall star rating formula seems to give the most weight to the 10-year period, the most recent three-year period actually has the greatest impact because it is included in all three rating periods. Past performance is no guarantee of future results.
©2026 Morningstar, Inc. All Rights Reserved. Morningstar and/or its content providers are the proprietors of this information; do not permit its unauthorized copying or distribution; do not warrant it to be accurate, complete or timely; and are not responsible for damages or losses arising from its use.
SURE received four stars for the 3-year rating among 365 funds, four stars for the 5-year rating among 345, four stars for the 10-year rating among 264 funds, and four stars for the overall rating among 365 funds in Morningstar’s Mid-Cap Blend category as of June 30th, 2026.
ETF
Social
Conversation