HDGE: 1st Quarter 2026 Portfolio Review
Performance
For the first quarter, the AdvisorShares Ranger Equity Bear ETF (HDGE) returned 11.44% (NAV) | 11.68% (market) while the S&P 500 Index returned -4.33%.
Top Holdings
| Ticker | Security Description | Portfolio Weight % |
| OZK | BANK OZK | 4.75% |
| CVNA | CARVANA CO | 3.75% |
| AIG | AMERICAN INTERNATIONAL GROUP | 3.21% |
| CVSA | COVISTA INC | 3.09% |
| AMH | AMERICAN HOMES 4 RENT- A | 2.89% |
| CART | MAPLEBEAR INC | 2.84% |
| OMF | ONEMAIN HOLDINGS INC | 2.61% |
| ACIW | ACI WORLDWIDE INC | 2.50% |
| ALLY | ALLY FINANCIAL INC | 2.39% |
| PRKS | UNITED PARKS & RESORTS INC | 2.39% |
As of 03.31.2026. Cash not included. Holdings subject to change.
Markets Review
The fund continues to maintain an aggressive short position. However, we expect our exposure to continue to vary more than in typical quarters.
Three factors in the current market suggest that the move to the downside will be exacerbated when the tide turns. 2026 as concentration risk remains at the top-end of the major indexes.
Those factors are:
- Overvaluation
- Excessive leverage
- Increased Volatility and fluctuations in investor sentiment
A summary of each factor is presented below.
Meanwhile, equities remain over-owned and overvalued, in our opinion.
Overvaluation
As the table below shows, several key valuation metrics are well in excess of historical norms.
For example, the market’s Q Ratio, which measures the market’s total value to the replacement cost of assets is 127% from its mean.
Collectively, the four metrics are 143% from its mean, and reside over three standard deviations above historical norms.
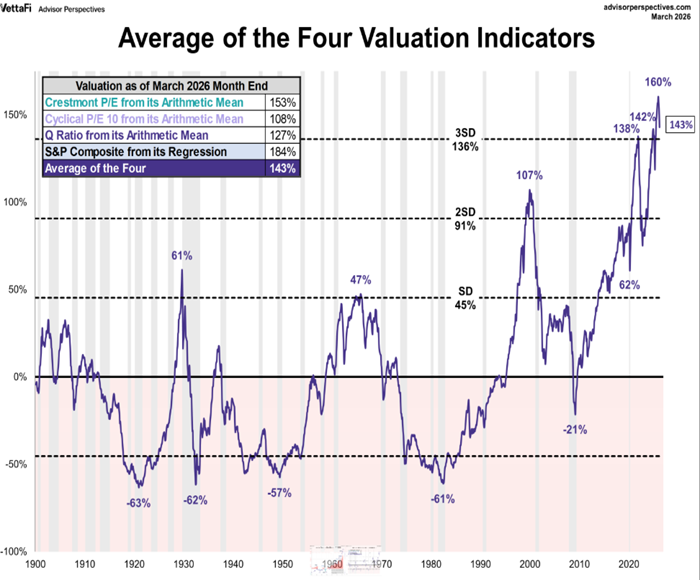
Source: VettaFi; Advisor Perspectives as of March 2026.
Excessive Leverage
As we have warned in past commentaries, investor credit balances have exploded, and many speculators are leaning in one direction.
This trend continues. Prior bear markets have brought the disparity back into balance. Such an expansion in leverage greatly increases the downside risk as the market moves down. These are weak holders forced to sell by margin departments—often at the worst time.
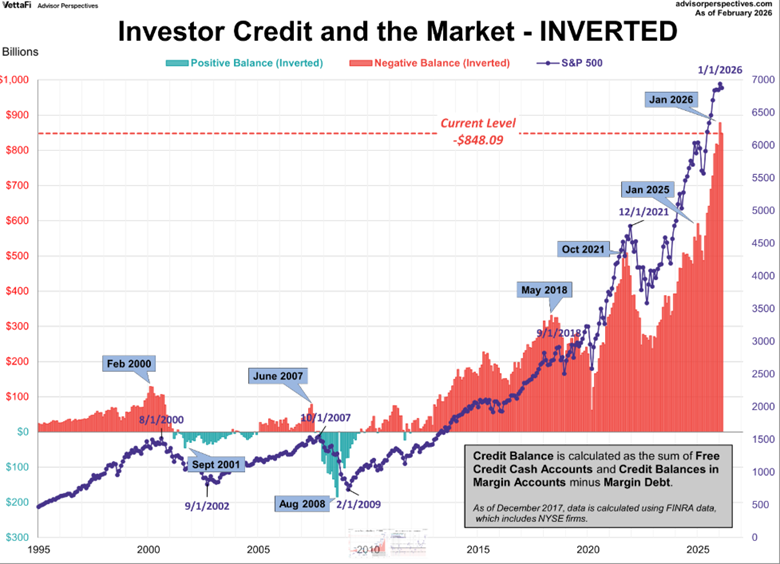
Source: Source: VettaFi; Advisor Perspectives as of February 2026.
Extreme valuation metrics illustrate how far the market could fall in order to comes back into normal ranges.
Excessive credit balances suggest the past at which this could happen – quickly.
Volatility and Sentiment
Several of our technical indicators became pressed to the downside in March 2026. As a result, our exposure shifted to lower ranges for a period of time until the deep oversold conditions worked themselves out.
One publicly available indicator is the CNN Fear & Greed Index, which recently hit “extreme fear” levels. Typically when our technical indicators and market sentiment reach extreme levels to the downside, the lowest quality stocks – which make for the ideal short positions under normal circumstances in our opinion – snapback the hardest.
As a result, we adjust our exposure temporarily to manage risk and reduce the beta of the portfolio.
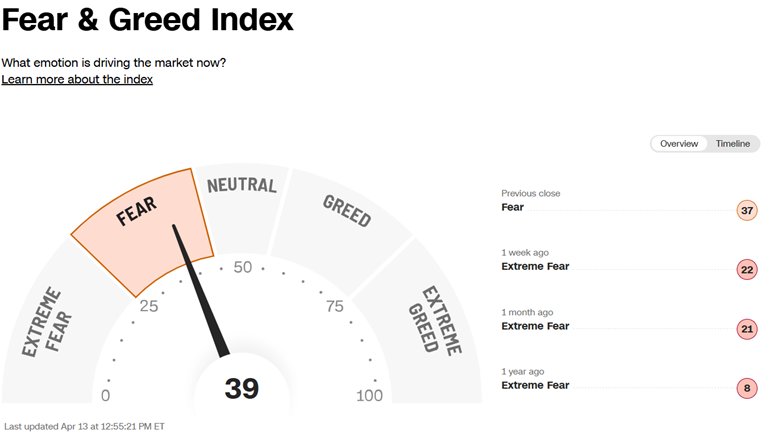
Source: Market Watch, via CNN’s Fear & Greed Index, as of April 13th, 2026.
As conditions revert to normal levels, exposure is added back on.
Due to recent geopolitical events, shifting market sentiment, and market volatility, we would expect more varying exposure in the coming quarters.
Respectfully,![]()
![]()

Brad Lamensdorf Jon DelVecchio
Ranger Alternative Management
AdvisorShares Ranger Equity Bear ETF (HDGE) Portfolio Managers
Past Commentary
Definitions:
Beta – a financial metric that measures how much a specific stock’s price moves in relation to the overall market. It is a key indicator of volatility, how wildly a stock swings, and helps investors understand the risk of adding a position to their portfolio.
P/E 10 ratio – a valuation indicator, commonly used with major equity indexes, factoring in real per-share earnings over a 10-year period. It is also known as the cyclically adjusted price earnings ratio.
Crestmont P/E ratio – a valuation metric that compares the price of a stock or the overall market to its earnings, specifically using the average earnings over a ten-year period.
Q Ratio – a valuation method that divide the market value of a company by the replacement value of the firm’s assets; also known as Tobin’s Q.
Equity risk premium – represents the additional return stocks offer over risk-free investments like Treasury bills, compensating investors for higher risks.
The S&P 500 Index is a free-float capitalization-weighted index based on the common stock prices of 500 American companies. It is one of the most commonly followed equity indices and many consider it the best representation of the market and a bellwether for the U.S. economy.
A Bear Market (Bearish) is a market condition in which the prices of securities are falling, and widespread pessimism causes the negative sentiment to be self-sustaining. As investors anticipate losses in a bear market and selling continues, pessimism only grows. Although figures can vary, for many, a downturn of 20% or more in multiple broad market indexes, such as the Dow Jones Industrial Average (DJIA) or Standard & Poor’s 500 Index (S&P 500), over at least a two-month period, is considered an entry into a bear market.
A Bull Market (Bullish) is a financial market of a group of securities in which prices are rising or are expected to rise. The term “bull market” is most often used to refer to the stock market, but can be applied to anything that is traded, such as bonds, currencies and commodities.
The Dow Jones Industrial Average (DJIA) is a stock market index of 30 prominent companies listed on stock exchanges in the United States. The DJIA is one of the oldest and most commonly followed equity indexes.
The Nasdaq 100 Index is a stock index of the 100 largest companies by modified market capitalization trading on Nasdaq exchanges, excluding companies in the financial sector.
A short position is the sale of a borrowed investment with the expectation that it will decline in value.
Volatility is a statistical measure of the dispersion of returns for a given security or market index. Volatility can either be measured by using the standard deviation or variance between returns from that same security or market index. Commonly, the higher the volatility, the riskier the security.
Implied Volatility is the estimated volatility of a security’s price. In general, implied volatility increases when the market is bearish and decreases when the market is bullish. This is due to the common belief that bearish markets are more risky than bullish markets.
The Volatility Index (VIX) is the ticker symbol for the Chicago Board Options Exchange (CBOE) Volatility Index, which shows the market’s expectation of 30-day volatility. It is constructed using the implied volatilities of a wide range of S&P 500 index options. This volatility is meant to be forward looking and is calculated from both calls and puts. The VIX is a widely used measure of market risk and is often referred to as the “investor fear gauge”. The VIX is a contrarian sentiment indicator that helps to determine when there is too much optimism or fear in the market.
Before investing you should carefully consider the Fund’s investment objectives, risks, charges and expenses. This and other information is in the prospectus or summary prospectus, a copy of which may be obtained by visiting www.advisorshares.com. Please read the prospectus carefully before you invest. Foreside Fund Services, LLC, distributor.
There is no guarantee that the Fund will achieve its investment objective. An investment in the Fund is subject to risk, including the possible loss of principal amount invested. The Fund may invest in (or short) ETFs, ETNs and ETPs. In addition to the risks associated with such vehicles, investments, or reference assets in the case of ETNs, lack of liquidity can result in its value being more volatile than the underlying portfolio investment. Other Fund risks include market risk, equity risk, short sales and leverage risk, large cap risk, early closing risk, liquidity risk and trading risk. Short sales involve leverage because the Fund borrows securities and then sells them, effectively leveraging its assets. The use of leverage may magnify gains or losses for the Fund. See prospectus for specific risks and details.
Shares are bought and sold at market price (closing price) not NAV and are not individually redeemed from the Fund. Market price returns are based on the midpoint of the bid/ask spread at 4:00 pm Eastern Time (when NAV is normally determined), and do not represent the return you would receive if you traded at other times.
Holdings and allocations are subject to risks and change.
The views in this commentary are those of the portfolio manager and many not reflect his views on the date this material is distributed or any time thereafter. These views are intended to assist shareholders in understanding their investments and do not constitute investment advice.