CWS: 4th Quarter 2025 Portfolio Review
Market Review
Wall Street had an exciting ride in 2025. In the spring, a potential trade war caused the stock market to experience some of its most dramatic volatility in decades. Near the end of the year, investors had to contend with a government shutdown. On top of that, the shutdown deprived investors of many of the key economic reports used to tell us how well, or poorly, the economy is doing.
Overall, the stock market had another good year in 2025. The index reached another new closing high on Christmas Eve. One drawback of the 2025 market is that the gains were tilted to higher-risk stocks. Many conservative stocks trailed the overall market. That’s not unusual but it’s been happening for the last three years.
Also, in 2025, the Federal Reserve decided to resume cutting interest rates. During the last four months of the year, the Fed cut rates three times. This was a big lift for investors. The central bank hinted that we can expect more cuts in 2026.
Portfolio Review
The fourth quarter is also the time of year when we make our portfolio changes for the new year. Five new stocks go into the portfolio, and five stocks go out.
For 2026, our five new buys are Casey’s General Stores (CASY), Comfort Systems USA (FIX), McKesson (MCK), ResMed (RMD) and Sprouts Farmers Market (SFM).
The five sells are Fiserv (FISV), McGrath RentCorp (MGRC), Miller Industries (MLR), Otis Worldwide (OTIS) and Silgan (SLGN).
Here are the corporate descriptions of our new stocks:
Casey’s is a Fortune 500 company operating approximately 2,900 convenience stores. Founded more than 50 years ago, the company has grown to become the third-largest convenience store retailer and the fifth-largest pizza chain in the United States. Casey’s provides freshly prepared foods, quality foods and friendly service at its locations. Guests can enjoy pizza, donuts, other assorted bakery items, and a wide selection of beverages and snacks.
Comfort Systems USA is a premier provider of business solutions addressing workplace comfort, with 184 locations in 139 cities around the nation.
McKesson Corporation is a diversified healthcare services leader dedicated to advancing health outcomes for patients everywhere. Our teams partner with biopharma companies, care providers, pharmacies, manufacturers, governments, and others to deliver insights, products and services to help make quality care more accessible and affordable.
Resmed creates life-changing health technologies that people love. We’re relentlessly committed to pioneering innovative technology to empower millions of people in 140 countries to live happier, healthier lives. Our AI-powered digital health solutions, cloud-connected devices and intelligent software make home healthcare more personalized, accessible and effective. Ultimately, Resmed envisions a world where every person can achieve their full potential through better sleep and breathing, with care delivered in their own home.
True to its farm-stand heritage, Sprouts offers a unique grocery experience featuring an open layout with fresh produce at the heart of the store. Sprouts inspires wellness naturally with a carefully curated assortment of better-for-you products paired with purpose-driven people. The healthy grocer continues to bring the latest in wholesome, innovative products made with lifestyle-friendly ingredients such as organic, plant-based and gluten-free. Headquartered in Phoenix, and one of the largest and fastest growing specialty retailers of fresh, natural and organic food in the United States, Sprouts employs approximately 35,000 team members and operates more than 450 stores in 24 states nationwide.
Top Holdings
| Ticker | Security Description | Portfolio Weight % |
| MCO | MOODY’S CORP | 4.09% |
| SFM | SPROUTS FARMERS MARKET INC | 4.05% |
| ABT | ABBOTT LABORATORIES | 4.04% |
| TMO | THERMO FISHER SCIENTIFIC INC | 4.03% |
| FDS | FACTSET RESEARCH SYSTEMS INC | 4.02% |
| SYK | STRYKER CORP | 4.01% |
| ADBE | ADOBE INC | 4.00% |
| ICE | INTERCONTINENTAL EXCHANGE INC | 4.00% |
| COR | CENCORA INC | 4.00% |
| MCK | MCKESSON CORP | 4.00% |
As of 12.31.2025. Holdings subject to change.
Performance Review
For the fourth quarter of 2025, the traded shares of the AdvisorShares Focused Equity ETF (CWS) were up 0.34% while the Net Asset Value gained 0.33%. That compares with a gain of 2.66% for the S&P 500.
While the underperformance is unfortunate, it reflects the safety-first nature of CWS.
I should point out that CWS tends to be much more conservative than the rest of the market. For example, the “beta” of the ETF is 0.70. Beta is a measure of systemic risk. Any number below 1.0 indicates a conservative and less-volatile strategy.
For the entire year, the AdvisorShares Focused Equity ETF saw its traded shares gain 6.33%, while the Net Asset Value increased by 6.31%. That compares with a gain of 17.88% for the S&P 500.
Here’s a look at how the ETF has fared since it started trading more than nine years ago:
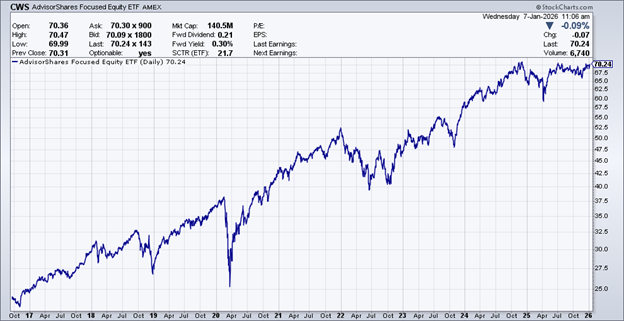
Source: StockCharts.com; from 10.01.2017 to 01.07.2026. Past performance is no guarantee of future returns.
Another Solid Earnings Season for Us
Let’s look at some of the earnings reports that helped the ETF during Q4.
In October, Abbott Labs (ABT) reported Q3 earnings of $1.30 per share. That matched Wall Street’s consensus. It was also in the dead center of Abbott’s guidance for $1.28 to $1.32 per share.
Overall, this was a decent quarter for Abbott. It’s pretty much what I had been expecting, perhaps a tad weaker but nothing to be alarmed about. Q3 sales rose 6.9%—7.5% on an organic basis when you exclude Covid-testing revenue. Quarterly sales came in at $11.37 billion, which was slightly below estimates of $11.39 billion.
Abbott was able to increase its operating margin by 40 basis points to 23.0%. The company also narrowed its full-year guidance to a range of $5.12 to $5.18 per share. That’s two cents off the top and bottom. It’s also a nice improvement over the $4.67 per share ABT made last year.
“Our third-quarter results demonstrate our ability to deliver consistent, high-quality performance,” said Robert B. Ford, chairman and chief executive officer, Abbott. “Our differentiated product pipeline continues to power our performance and positions Abbott to deliver durable long-term value to our shareholders.”
Abbott stood by its previous full-year-2025 organic-sales-growth guidance of 7.5% to 8.0%. That also excludes Covid testing revenue. The new EPS guidance implies Q4 earnings of $1.47 to $1.53 per share. I think that’s very doable. Abbott has increased its dividend for 54 consecutive years.
Since Mueller Industries (MLI) is only followed by one analyst, I can’t say if it beat earnings or not, but the stock rallied more than 4% on after its last earnings report, which tells me that it did.
For Q3, Mueller earned $1.88 per share. That’s up from $1.48 per share for last year’s Q3. The company has no debt and a cash position of $1.3 billion.
I am concerned about the potential impact of tariffs, so I was glad to see CEO Greg Christopher downplay their effect. “As for heightened tariffs, we maintain our belief that they will ultimately benefit our business as we manufacture just a small percentage of our products overseas for importation into the U.S. market. Nonetheless, we have accelerated plans to increase our manufacturing capabilities in the U.S., onshore some of our own manufacturing and otherwise enhance our ability to respond to growing calls for domestically produced products.”
Mueller has already earned $5.48 per share for the first three quarters of this year. The company made $1.21 per share for last year’s Q4, so if they can match that result, that would translate into full-year earnings of $6.69 per share. That means the stock is going for less than 16 times earnings.
In October, Amphenol (APH) said it made 93 cents per share for its fiscal Q3. That’s up 86% over last year. It was also beat Wall Street’s forecast for 80 cents per share. The company had told us to expect earnings between 77 and 79 cents per share.
APH was expecting quarterly sales between $5.4 and $5.5 billion, which represents growth of 34% to 36%. Instead, sales were up 53% to $6.2 billion. Operating-cash flow was $1.5 billion, and free-cash flow was $1.2 billion.
Amphenol also hiked its quarterly dividend from 16.25 to 25 cents per share. This is Amphenol’s 14th annual dividend hike in a row.
For its fiscal Q4, APH sees sales coming in between $6.0 and $6.1 billion, which means growth of 39% to 41%. Amphenol also sees Q4 earnings between 89 and 91 cents per share. That’s growth of 62% to 65%.
For all of 2025, Amphenol expects sales of $22.66 to $22.76 billion, and earnings of $3.26 to $3.28 per share. The stock rallied close to 9% in two days and hit a new high.
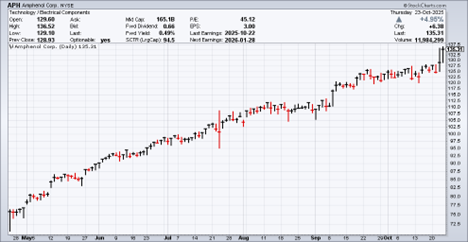
Source: StockCharts.com; from 04.28.2025 to 10.31.2025. Past performance is no guarantee of future returns.
Moody’s (MCO) said it made $3.92 per share for Q3. That’s up 22% over last year. Wall Street had been expecting $3.68 per share.
Moody’s Analytics had revenue growth of 9%, and Moody’s Analytics saw its revenues rise by 12%. Both businesses brought in about $1 billion.
Now for the best news. Moody’s raised its full-year guidance. It had been for earnings between $13.50 and $14.00 per share. Now Moody’s has said it will make between $14.50 and $14.75 per share for this year. At the midpoint, that’s growth of 17%.
Since Moody’s has already made $11.30 per share for its first three quarters, the new guidance implies Q4 earnings between $3.20 and $3.45 per share.
Thermo Fisher Scientific (TMO) has done a big turnaround for us in 2025. It started off poorly but has since recovered very nicely. The company has made news recently by floating $2.5 billion in bonds, and by announcing a partnership with the AstraZeneca BioVentureHub in Gothenburg, Sweden.
For Q3, Themo grew its earnings by 10% to $5.79 per share. That topped Wall Street’s consensus of $5.50 per share. Thermo improved its operating margin by 100 basis points to 23.3%.
So far this year, Thermo’s free-cash flow is $3.3 billion. TMO has bought back $1 billion in shares. The company also raised its 2025 revenue guidance to $44.1 to $44.5 billion.
Thermo also raised its 2025 earnings guidance. The company sees earnings ranging between $22.60 and $22.86 per share. That’s up from $22.22 to $22.84 per share. That’s implied guidance of $5.92 to $6.54 per share for Q4.
Outlook
I’m very optimistic for 2026. I expect to see a more favorable regulatory climate. I also think the Federal Reserve will aid investors with lower interest rates. The economy is showing some weak spots but we’re not close to a recession. I expect to see more great returns for CWS.
![]() Respectfully,
Respectfully,
Eddy Elfenbein
Crossing Wall Street
AdvisorShares Focused Equity ETF (CWS) Portfolio Strategist
Management Fee
In a first for the ETF industry, the portfolio str 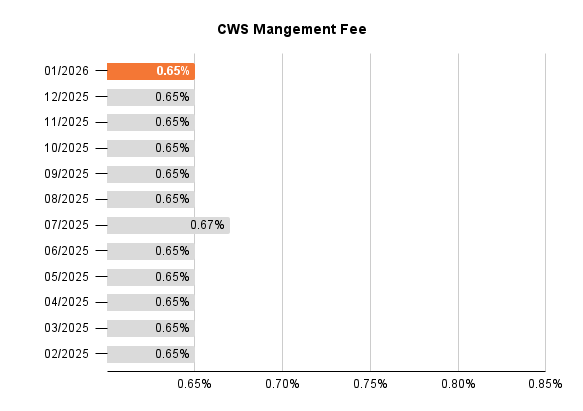 ategist of CWS has “skin in the game.” The strategist’s compensation is directly tied to portfolio’s performance. Using the trailing 12-month returns of CWS vs. its S&P 500 Index benchmark, stronger outperformance is rewarded with a larger management fee while weaker underperformance is penalized with a smaller management fee.
After the Fund’s December performance, the CWS fulcrum fee will be 0.65% in January 2026.
Past Commentary
Definitions:
A basis point is one hundredth of a percentage point (0.01%).
The S&P 500 Index is a broad-based, unmanaged measurement of changes in stock market conditions based on the average of 500 widely held common stocks. One cannot invest directly in an index.
Before investing you should carefully consider the Fund’s investment objectives, risks, charges and expenses. This and other information is in the prospectus or summary prospectus, a copy of which may be obtained by visiting www.advisorshares.com. Please read the prospectus carefully before you invest. Foreside Fund Services, LLC, distributor.
There is no guarantee that the Fund will achieve its investment objective. An investment in the Fund is subject to risk, including the possible loss of principal amount invested. The prices of equity securities rise and fall daily. These price movements may result from factors affecting individual issuers, industries or the stock market as a whole. Shares of the Fund may trade above or below their net asset value (“NAV”). The trading price of the Fund’s shares may deviate significantly from their NAV during periods of market volatility. There can be no assurance that an active trading market for the Fund’s shares will develop or be maintained. In addition, equity markets tend to move in cycles which may cause stock prices to fall over short or extended periods of time. Other Fund risks include market risk, liquidity risk, large cap, mid cap, and small cap risk. Please see prospectus for details regarding risk.
Shares are bought and sold at market price (closing price) not NAV and are not individually redeemed from the Fund. Market price returns are based on the midpoint of the bid/ask spread at 4:00 pm Eastern Time (when NAV is normally determined), and do not represent the return you would receive if you traded at other times.
Holdings and allocations are subject to risks and to change.
The views in this commentary are those of the portfolio manager and may not reflect his views on the date this material is distributed or anytime thereafter. These views are intended to assist shareholders in understanding their investments and do not constitute investment advice.