
| Symbol | Exchange | Inception Date | CUSIP | NAV | Options Available |
|---|---|---|---|---|---|
| HVAC | NYSE Arca | 2/3/2025 | 00768Y271 | HVAC.NAV | Not Yet |

Miss the first whitepaper? Catch up Here: The Heat Is On
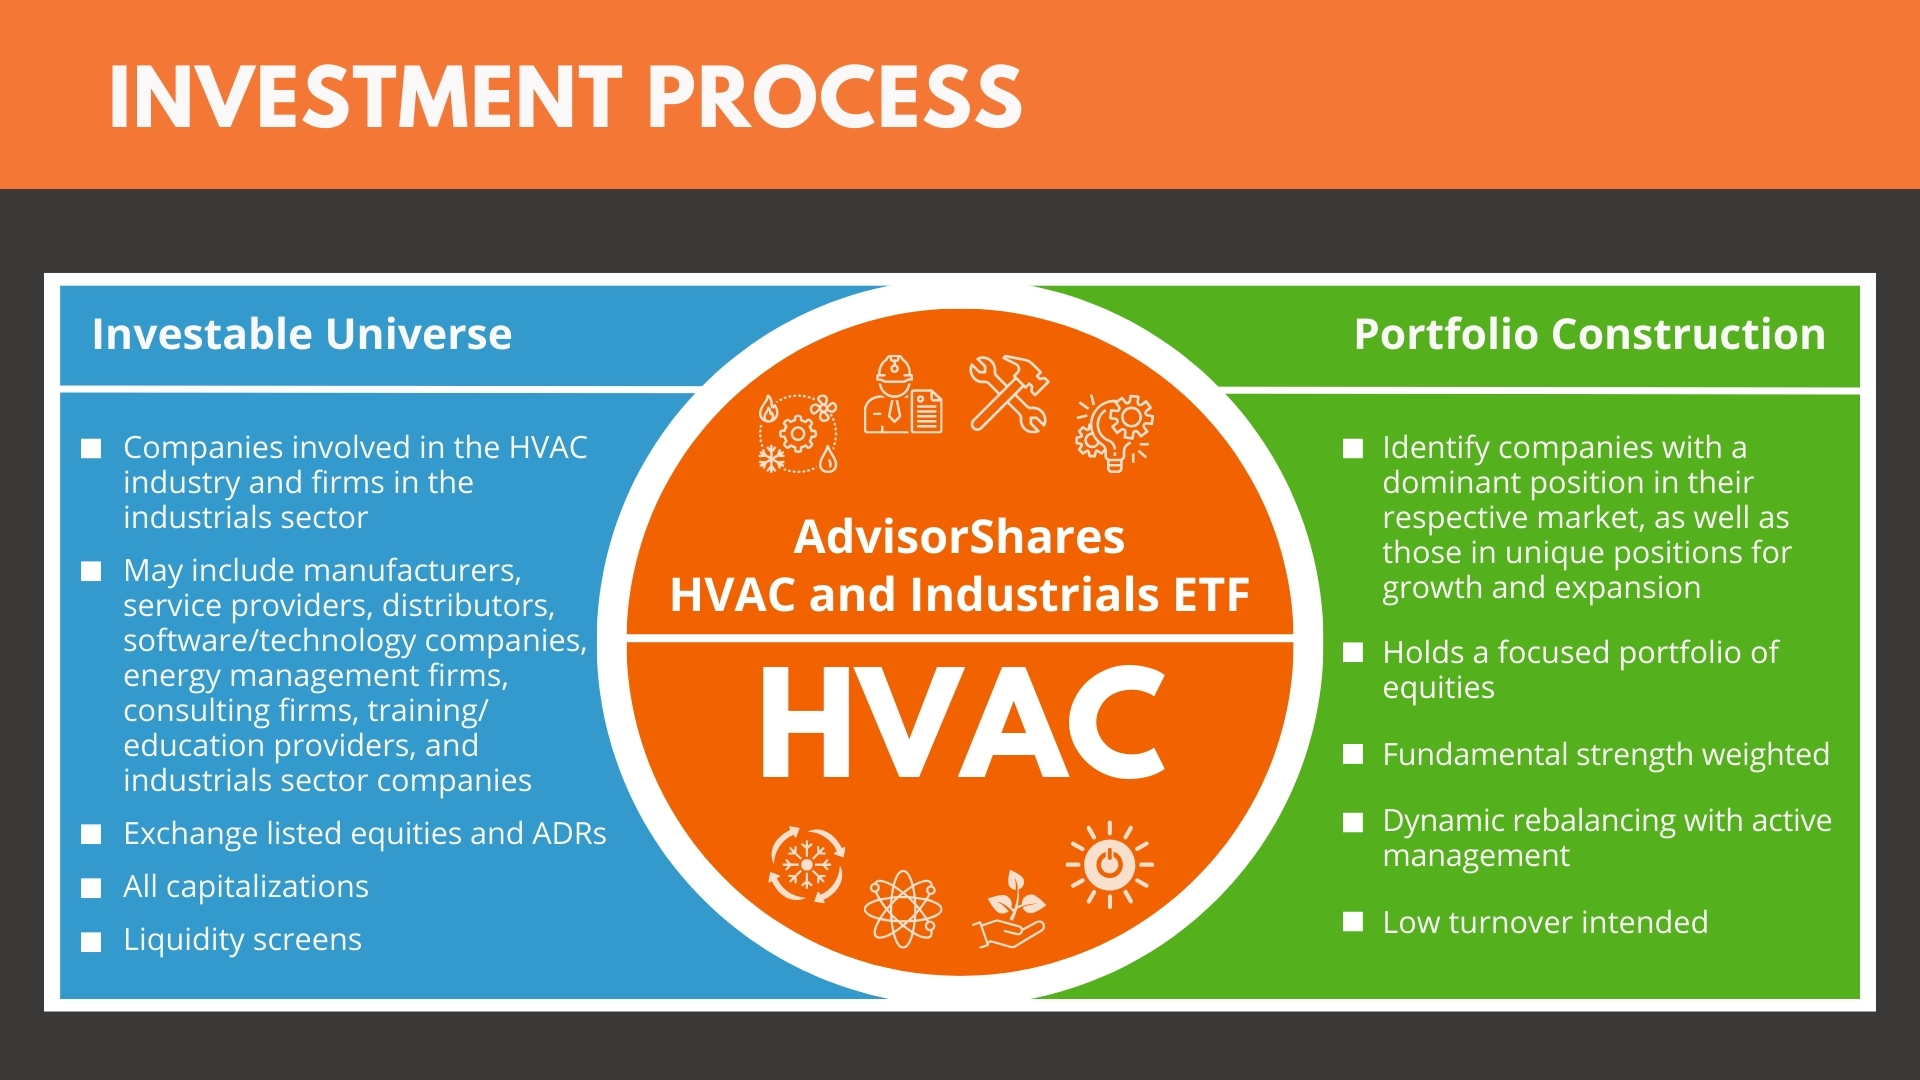
What Does HVAC Invest In?
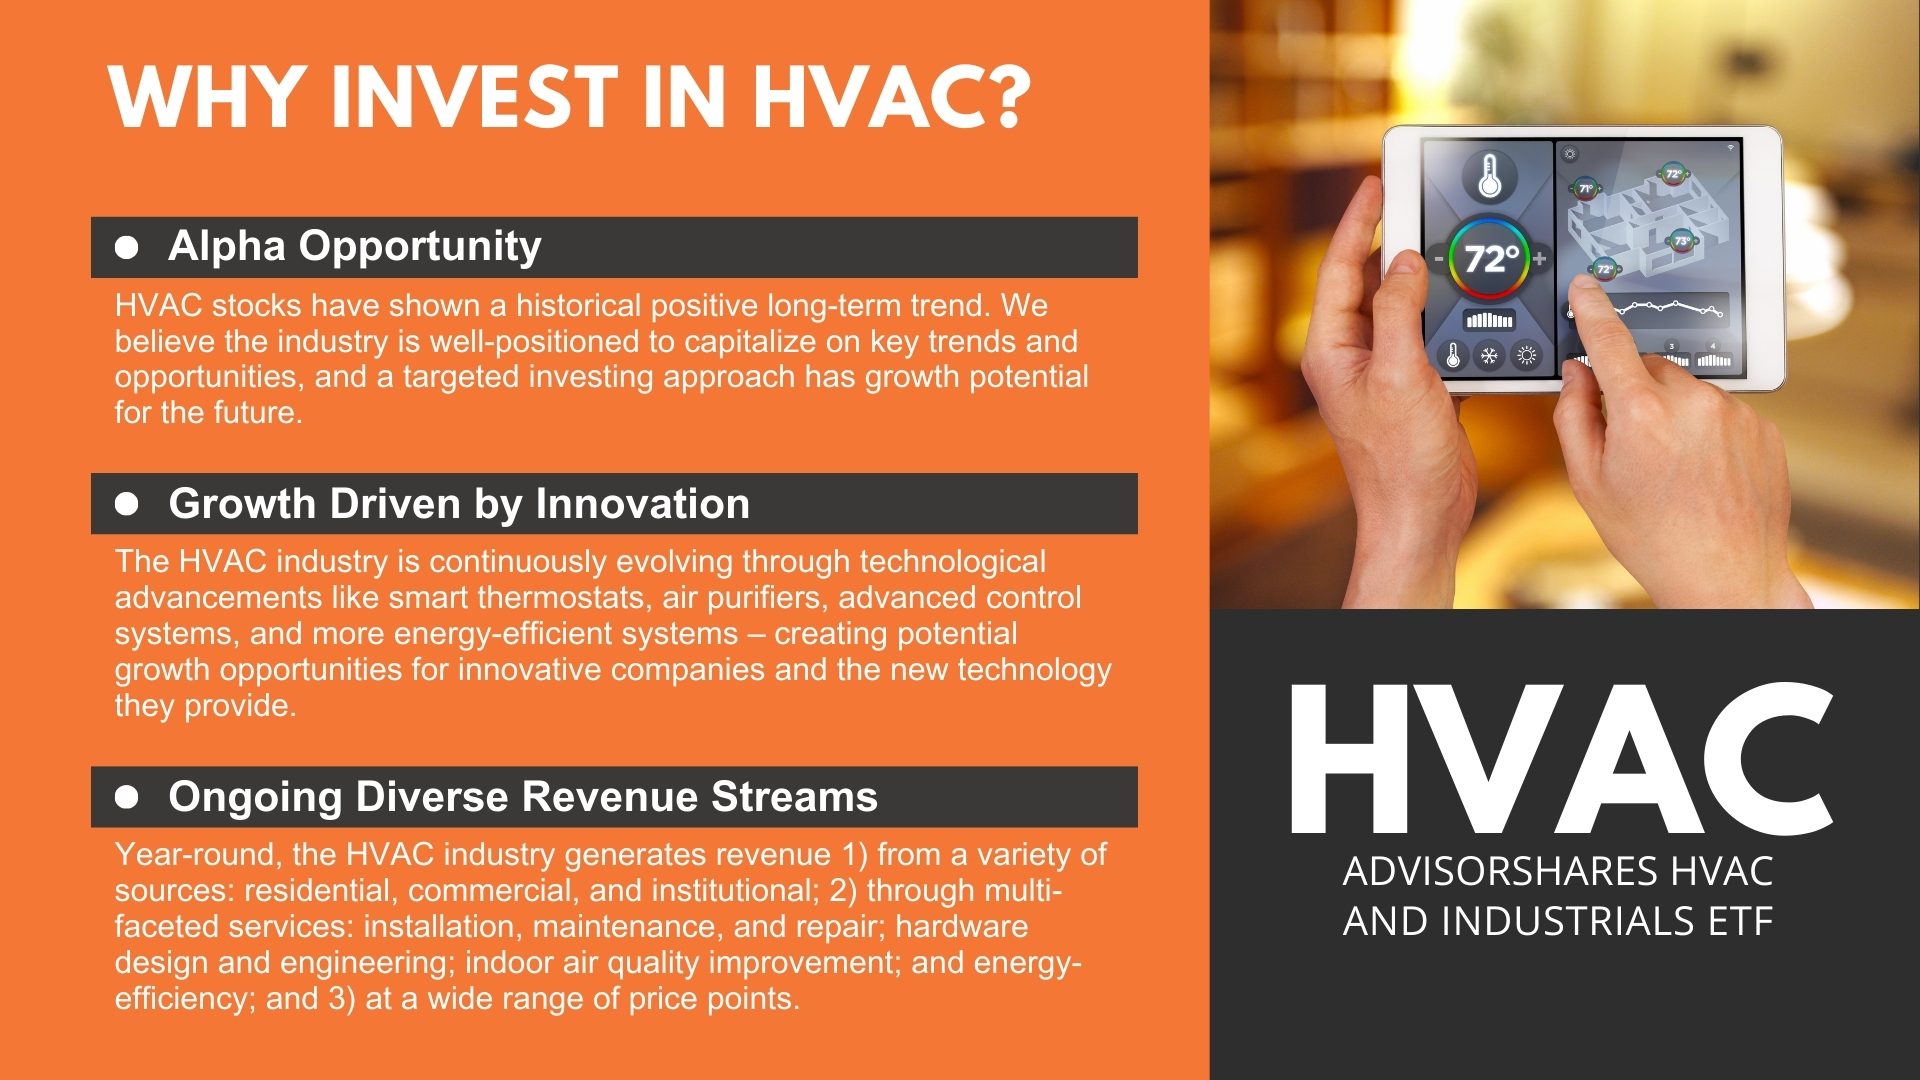
Why Invest in HVAC?
- Alpha Opportunity: Historically, heating, ventilation, and air conditioning (HVAC) stocks have shown a positive long-term trend. We believe the industry is well-positioned to capitalize on key trends, opportunities, and continued demand; and a targeted investing approach has growth potential for the future.
- Growth Driven by Innovation: The industry is continuously evolving through technological advancements like smart thermostats, air purifiers, advanced control systems, and more energy-efficient systems. This creates potential growth opportunities for innovative companies and the new technology they provide.
- Ongoing Diverse Revenue Streams: Year-round, the HVAC industry generates revenue 1) from a variety of sources: residential, commercial, and institutional; 2) through multi-faceted services: installation, maintenance, and repair; hardware design and engineering; indoor air quality improvement; and energy-efficiency; and 3) at a wide range of price points.
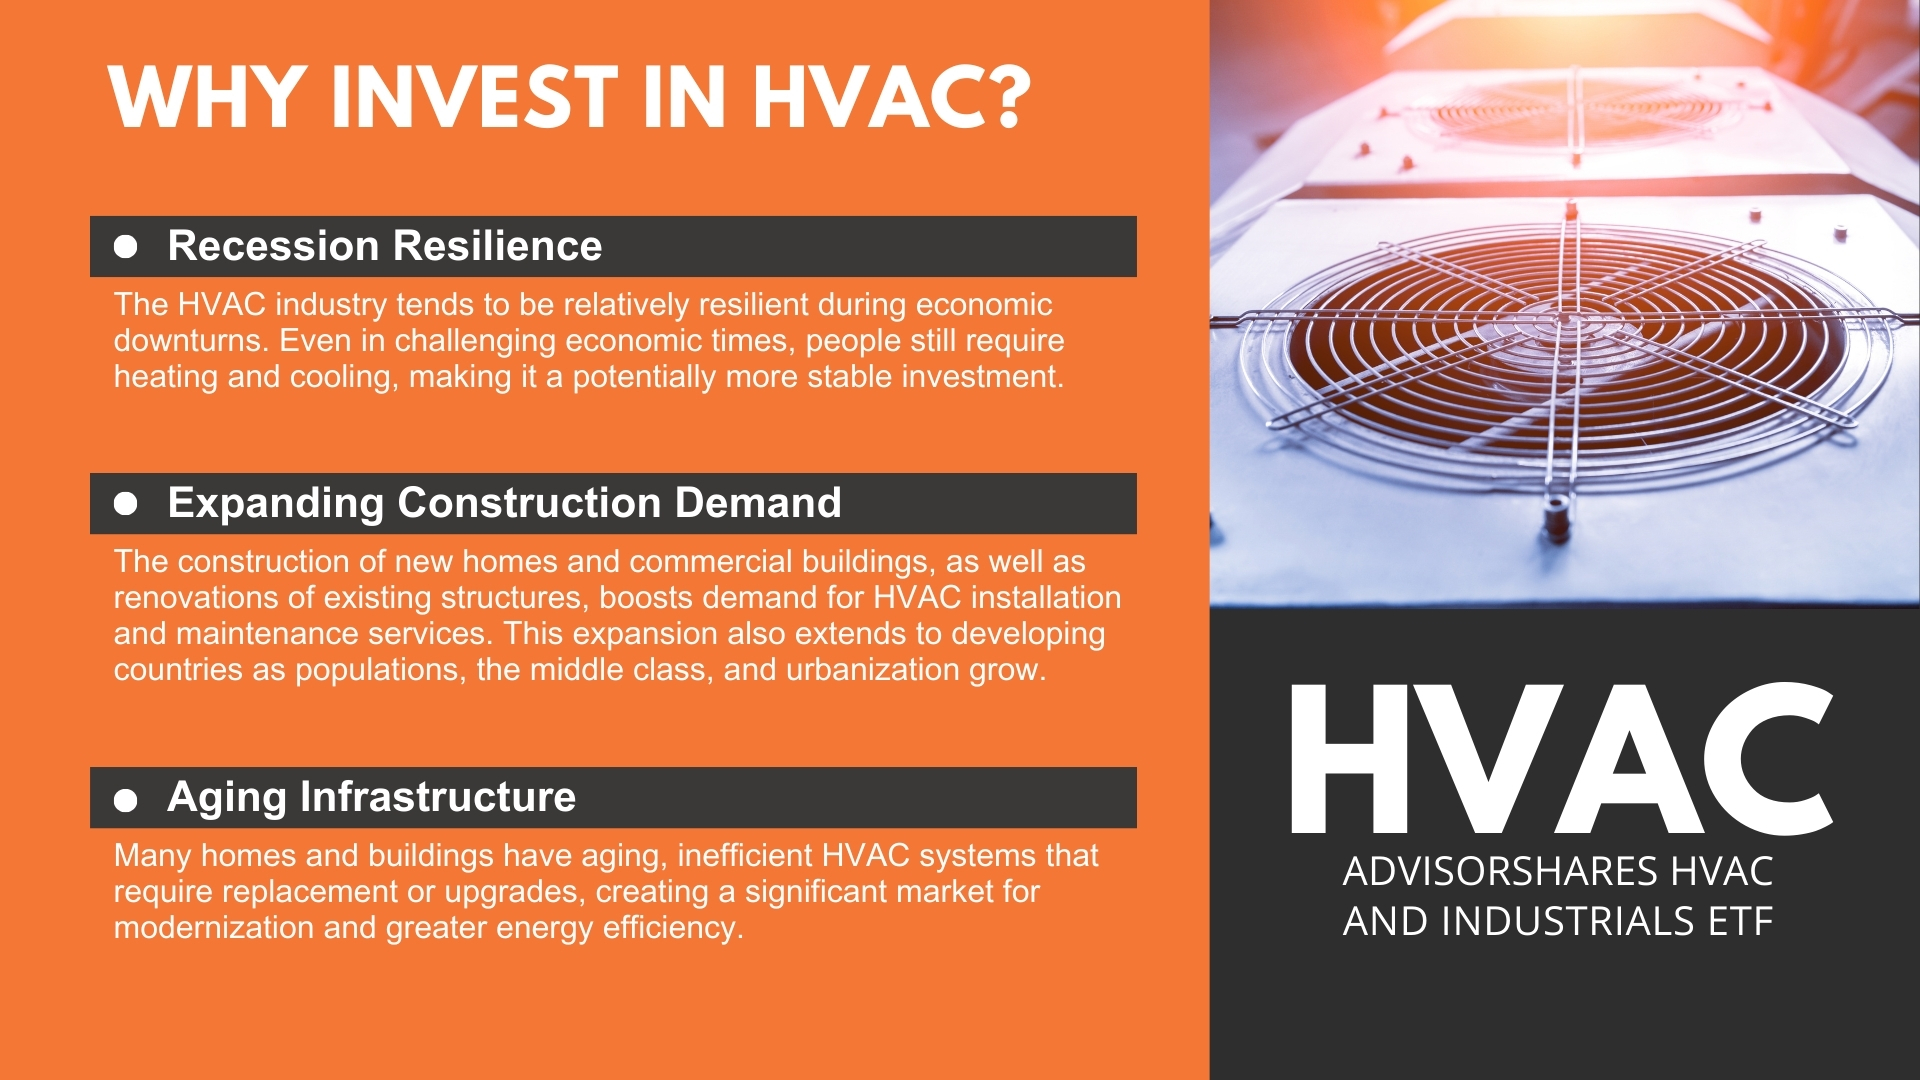
- Recession Resilience: The HVAC industry tends to be relatively resilient during economic downturns. Even in challenging economic times, people still require heating and cooling, making it a potentially more stable investment.
- Expanding Construction Demand: The construction of new homes and commercial buildings, as well as renovations of existing structures, boosts the demand for HVAC installation and maintenance services. This expansion also extends to developing countries as populations, the middle class, and urbanization grow.
- Aging Infrastructure: Many homes and buildings have aging, inefficient HVAC systems that require replacement or upgrades, creating a significant market for modernization and greater energy efficiency.
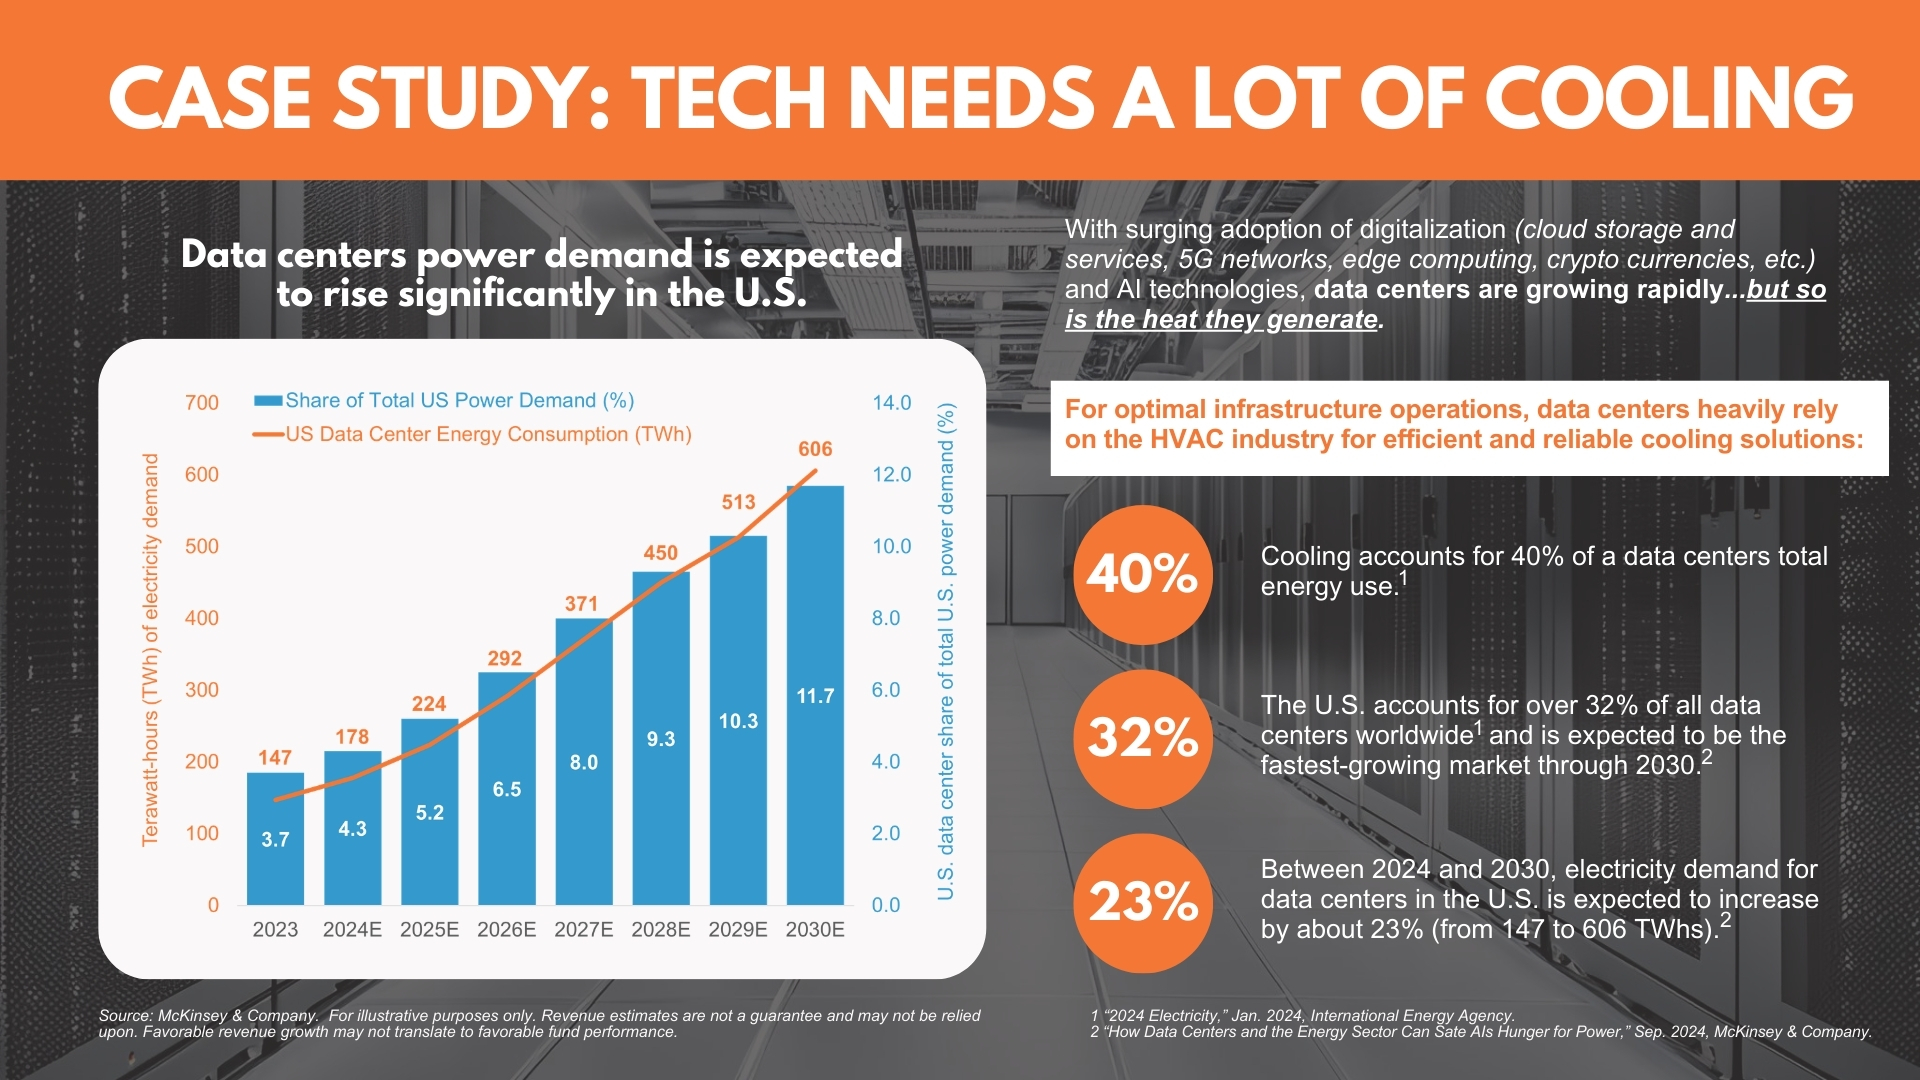
- Growing Data Center Demand: With the expansion of the digital world (i.e., AI/machine learning, cloud storage and services, 5G networks, edge computing, cryptocurrencies), data centers are growing rapidly and so is the heat they generate. For optimal infrastructure operations, data centers heavily rely on the HVAC industry for efficient and reliable cooling solutions.
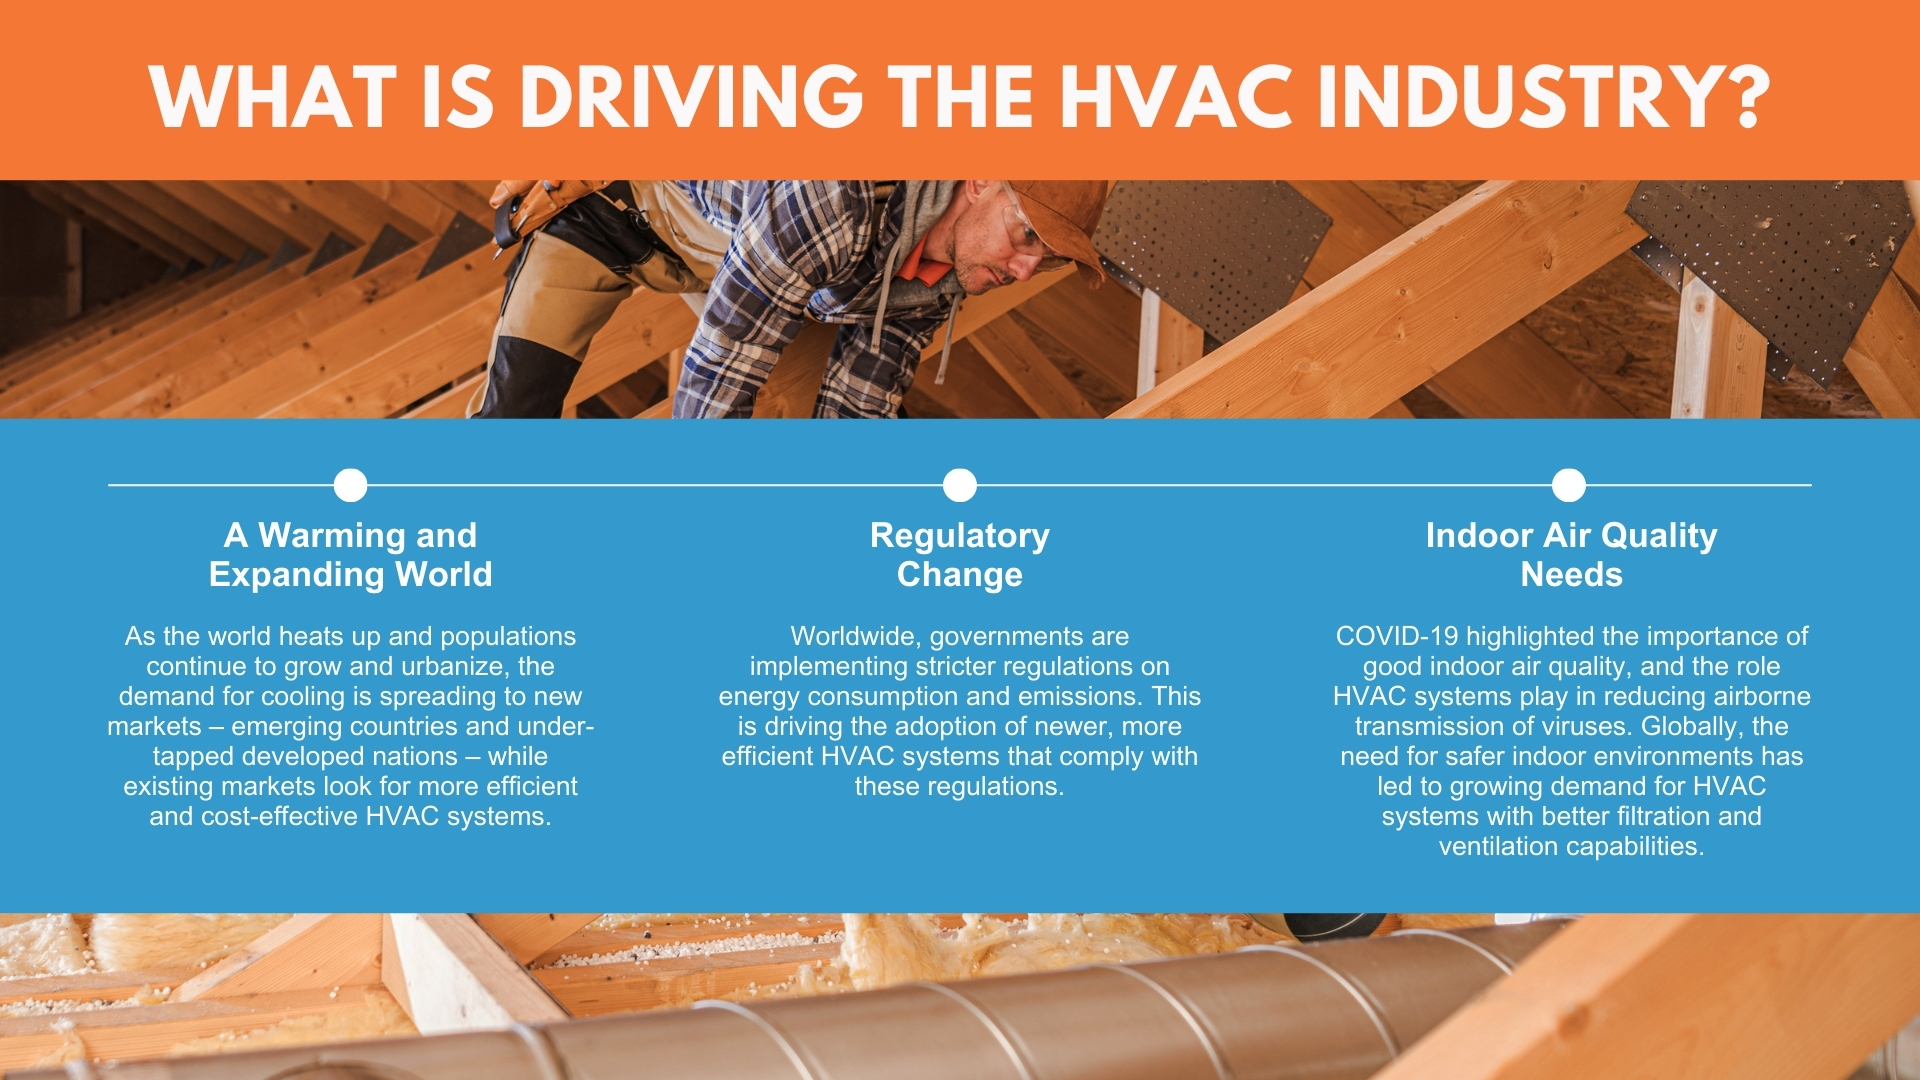
- Indoor Air Quality Needs: COVID-19 highlighted the importance of good indoor air quality, and the role HVAC systems play in reducing airborne transmission of viruses. Worldwide, the need for safer indoor environments has led to growing demand for HVAC systems with better filtration and ventilation capabilities.
Key Attributes
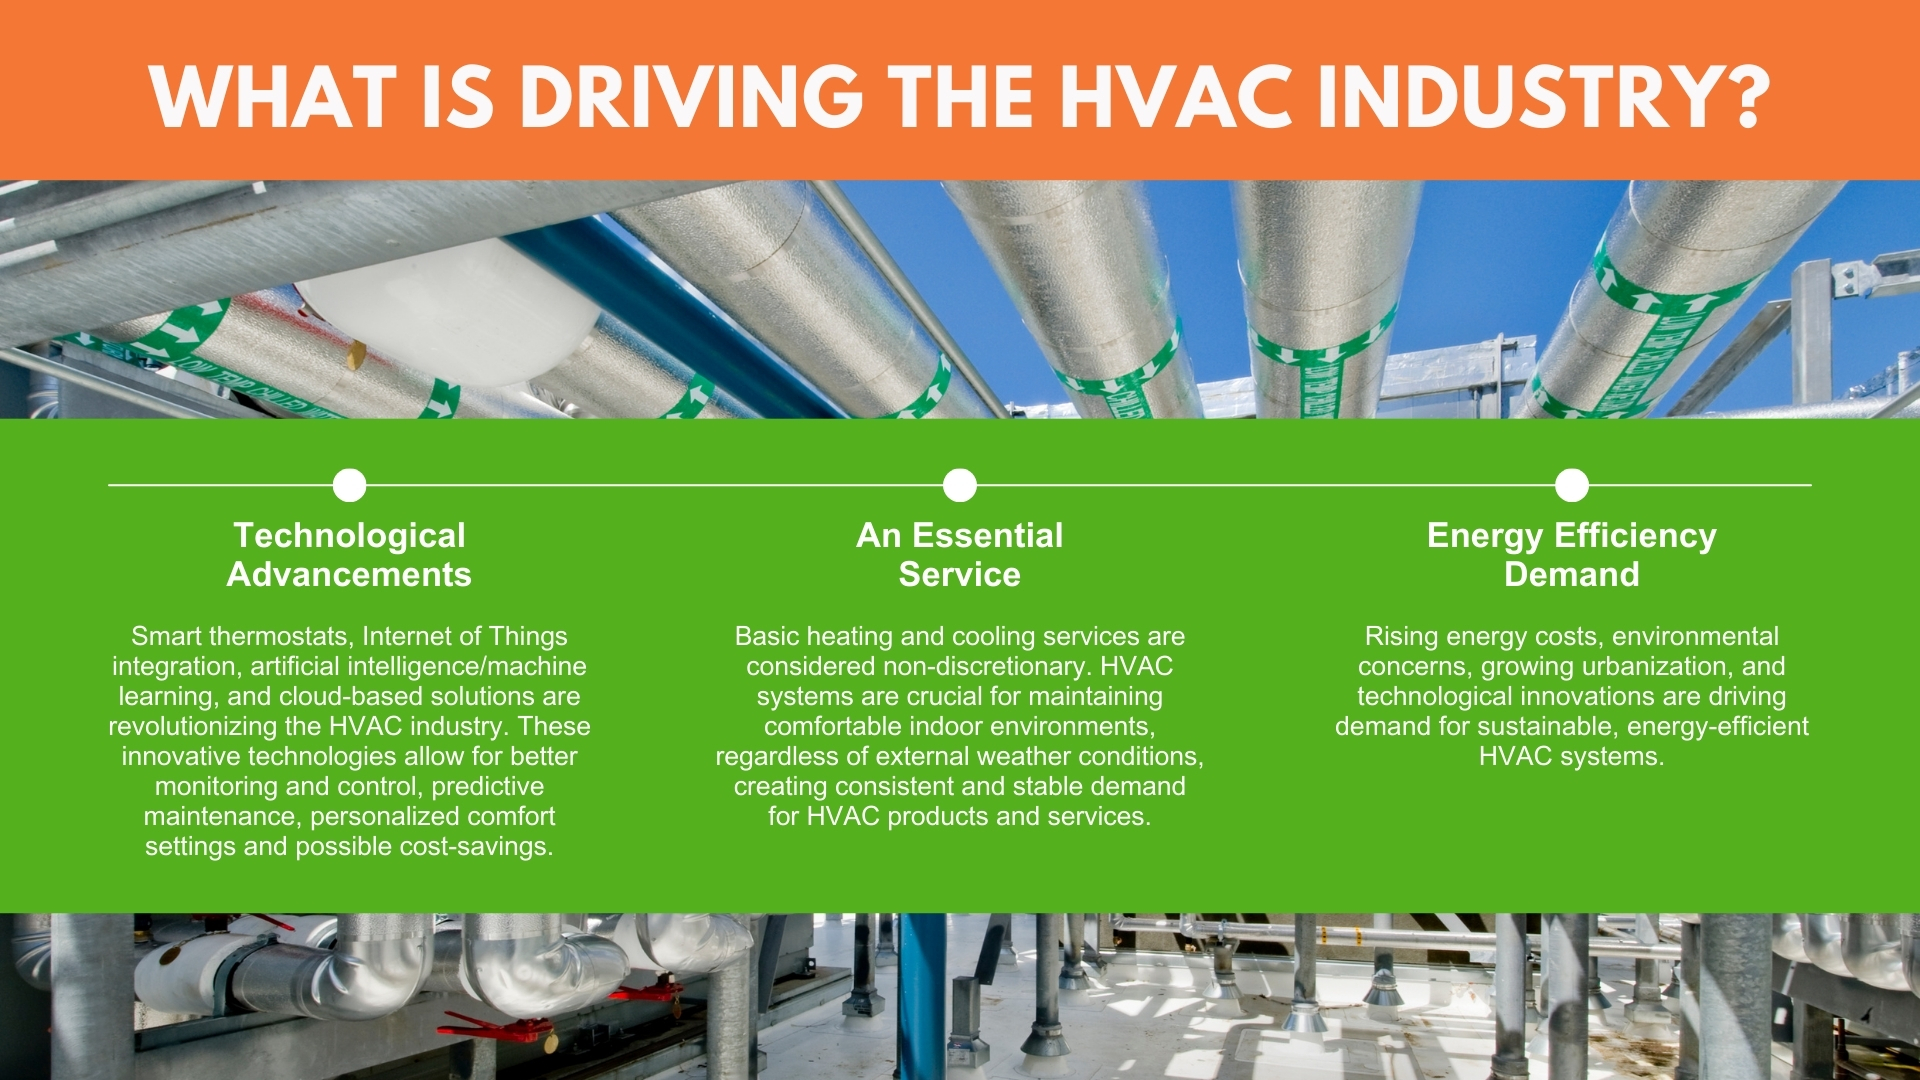
- An Essential Service: Basic heating and cooling services are considered non-discretionary. HVAC systems are crucial for maintaining comfortable indoor environments, regardless of external weather conditions, creating consistent and stable demand for HVAC products and services.
- Technology Driven: Through smart thermostats, Internet of Things integration, artificial intelligence/machine learning, and cloud-based solutions, technology is revolutionizing the HVAC industry. Technological innovation is helping HVAC systems to become more energy-efficient, reliable, and sustainable.
- Potential for High-Profit Margins: Due to their specialized skills and knowledge, as well as energy-efficient solutions, HVAC companies can charge premium rates for their services and products. Additionally, there is the opportunity for recurring revenue from maintenance contracts and service agreements.
- A Warming & Expanding World: As the world heats up and populations continue to grow and urbanize, the demand for cooling is spreading to new markets – emerging countries and under-tapped developed nations – while existing markets look for more efficient and cost-effective HVAC systems.
- Energy Efficiency Demand: Rising energy costs, environmental concerns, growing urbanization, and technological advancements drive the constant demand for sustainable, energy-efficient HVAC systems.
- Regulatory Change: Worldwide, governments are implementing stricter regulations on energy consumption and emissions. This is driving the adoption of newer, more efficient HVAC systems that comply with these regulations.
Where Can HVAC Fit in a Traditional Portfolio?
About the Portfolio Manager
Dan Ahrens | Portfolio Manager
Dan Ahrens is the Managing Director, Chief Investment Officer, and Chief Operating Officer of AdvisorShares, where he oversees more than $1 billion in actively managed ETF strategies spanning equity, fixed income, and thematic investing. Over a 20-year career in portfolio management, he has built a reputation for identifying emerging industries ahead of broader market adoption — launching the Vice Fund in 2002 and later developing one of the first institutional-quality cannabis ETF suites available to U.S. investors.
He is the author of two books on thematic investing published by St. Martin’s Press and Wiley, and has appeared as a financial commentator on CNBC, Bloomberg, Fox Business, CNN, and ABC News. His work has been covered in The Economist, The Wall Street Journal, The Financial Times, and The New York Times. AdvisorShares ETFs managed by Mr. Ahrens are available on all major custodial platforms, including Schwab, Fidelity, and Pershing.

HVAC Overview
Get an introduction to the HVAC ETF
Fund
Fund Data
6/29/2026| NAV | $40.69 |
| Change | $0.75 |
| Shares Outstanding | 360,000 |
| Assets Under Management | $14,650,030.74 |
Market Data
6/29/2026| Closing Price | $40.76 |
| Close Change | $0.99 |
| Volume | 31,010 |
Regulatory Data
6/29/2026| Premium Discount | $0.03 |
| 30-Day Median bid-ask Spread | 0.344573 |
Shares are bought and sold at market price (closing price) not NAV and are not individually redeemed from the Fund. Market price returns are based on the midpoint of the bid/ask spread at 4:00 pm Eastern Time (when NAV is normally determined), and do not represent the return you would receive if you traded at other times.
")
FUND
Characteristics
As of 5/31/2026
Source: Morningstar & AdvisorShares
 (300 x 300 px) (8)")
FUND
Performance
As of 5/31/2026
| NAV | Market Price Return | S&P 500 Index | |
|---|---|---|---|
| 1 Month | 1.09 | 1.25 | 5.26 |
| 3 Month | 8.09 | 8.38 | 10.52 |
| YTD | 29.94 | 30.25 | 11.27 |
| 1 Year | 55.50 | 55.83 | 29.78 |
| Since Inception (2/3/2025 Annualized) | 43.64 | 43.88 | 20.97 |
As of 3/31/2026
| NAV | Market Price Return | S&P 500 Index | |
|---|---|---|---|
| 1 Month | -8.16 | -8.17 | -4.98 |
| 3 Month | 10.40 | 10.36 | -4.33 |
| YTD | 10.40 | 10.36 | -4.33 |
| 1 Year | 54.92 | 54.83 | 17.80 |
| Since Inception (2/3/2025, Not Annualized) | 31.43 | 31.38 | 9.08 |
Get Social @AdvisorShares
Join the conversation on social media to hear more from the portfolio manager, get informed about upcoming events and webinars, and more!
| Date | Account Symbol | Stock Ticker | Security ID | Security Description | Shares | Share Price | Market Value | Portfolio Weight | Asset Group |
|---|---|---|---|---|---|---|---|---|---|
| 06/29/2026 | HVAC | STRL | 859241101 | STERLING INFRASTRUCTURE INC | 1,548 | 813.77 | 1,259,715.96 | 8.60% | S |
| FIX | 199908104 | COMFORT SYSTEMS USA INC | 544 | 1,948.69 | 1,060,087.36 | 7.24% | S | ||
| JBL | 466313103 | JABIL INC | 2,338 | 373.58 | 873,430.04 | 5.96% | S | ||
| APH | 032095101 | AMPHENOL CORP-CL A | 4,688 | 166.42 | 780,176.96 | 5.33% | S | ||
| CAT | 149123101 | CATERPILLAR INC | 710 | 1,033.19 | 733,564.90 | 5.01% | S | ||
| TT | G8994E103 | TRANE TECHNOLOGIES PLC | 1,477 | 480.35 | 709,476.95 | 4.84% | FS | ||
| CW | 231561101 | CURTISS-WRIGHT CORP | 956 | 737.39 | 704,944.84 | 4.81% | S | ||
| BDC | 077454106 | BELDEN INC | 5,866 | 118.66 | 696,059.56 | 4.75% | S | ||
| PWR | 74762E102 | QUANTA SERVICES INC | 968 | 714.45 | 691,587.60 | 4.72% | S | ||
| BE | 093712107 | BLOOM ENERGY CORP- A | 2,479 | 275.01 | 681,749.79 | 4.65% | S | ||
| NVT | G6700G107 | NVENT ELECTRIC PLC | 4,154 | 163.35 | 678,555.90 | 4.63% | FS | ||
| VRT | 92537N108 | VERTIV HOLDINGS CO-A | 2,199 | 306.97 | 675,027.03 | 4.61% | S | ||
| AAON | 000360206 | AAON INC | 5,242 | 125.71 | 658,971.82 | 4.50% | S | ||
| GEV | 36828A101 | GE VERNOVA INC | 568 | 1,102.51 | 626,225.68 | 4.27% | S | ||
| GNRC | 368736104 | GENERAC HOLDINGS INC | 2,206 | 283.81 | 626,084.86 | 4.27% | S | ||
| AME | 031100100 | AMETEK INC | 2,220 | 237.72 | 527,738.40 | 3.60% | S | ||
| MTZ | 576323109 | MASTEC INC | 1,142 | 429.09 | 490,020.78 | 3.34% | S | ||
| WLDN | 96924N100 | WILLDAN GROUP INC | 6,113 | 79.22 | 484,271.86 | 3.31% | S | ||
| MOD | 607828100 | MODINE MANUFACTURING CO | 1,816 | 256.34 | 465,513.44 | 3.18% | S | ||
| FTV | 34959J108 | FORTIVE CORP | 7,558 | 60.67 | 458,543.86 | 3.13% | S | ||
| DLR | 253868103 | DIGITAL REALTY TRUST INC | 2,119 | 190.58 | 403,839.02 | 2.76% | S | ||
| LGN | 52476L109 | LEGENCE CORP-CL A | 4,592 | 80.60 | 370,115.20 | 2.53% | S | ||
| X9USDDTP3 | DREYFUS TRSRY SECURITIES CASH MGMT | 67,799.46 | 1.00 | 67,799.46 | 0.46% | MM | |||
| CASH | -73,844.77 | 100.00 | -73,844.77 | -0.50% | CA |


FUND
Documents
FUND
Annual Fund Operating Expenses (expenses that you pay each year as a percentage of the value of your investment)
| Management Fee | 0.60% | |
| Other Expenses | 35.00% | |
| Acquired Fund Fees and Expenses* | 0.01% | |
| Gross Expense Ratio | 35.61% | |
| Fee Waiver/Expense Reimbursement* | -34.61% | |
| Net Expense Ratio | 1.00% |
| Expense Cap Limitation* | 0.99% |
*Please note, for newly launched ETFs with relatively low assets under management, operating expenses may represent a higher percentage of the Fund’s assets. AdvisorShares launches all new ETFs with contractual expense caps in place and has a history of renewing these caps until each Fund reaches a sustainable asset level and can operate at a reasonable expense ratio. Total Annual Operating Expenses and Total Annual Operating Expenses After Waiver/Reimbursement in this fee table may not correlate to the expense ratios in the Fund’s financial highlights because the financial highlights include only the Fund’s direct operating expenses and do not include Acquire Fund Fees and Expenses, which represent the Fund’s pro rata share of the fees and expenses of money market funds in which it invests. Total Annual Operating Expenses and Total Annual Operating Expenses After Wavier/Reimbursement in this fee table may not correlate to the expense ratios in the Fund’s financial highlights. The Advisor has contractually agreed to reduce its fees and/or reimburse expenses to keep net expenses from exceeding 0.99% of the Fund’s average daily net assets for at least one year from the date of the prospectus. For more information, please read the full prospectus.
Last Ten
Fund Distributions
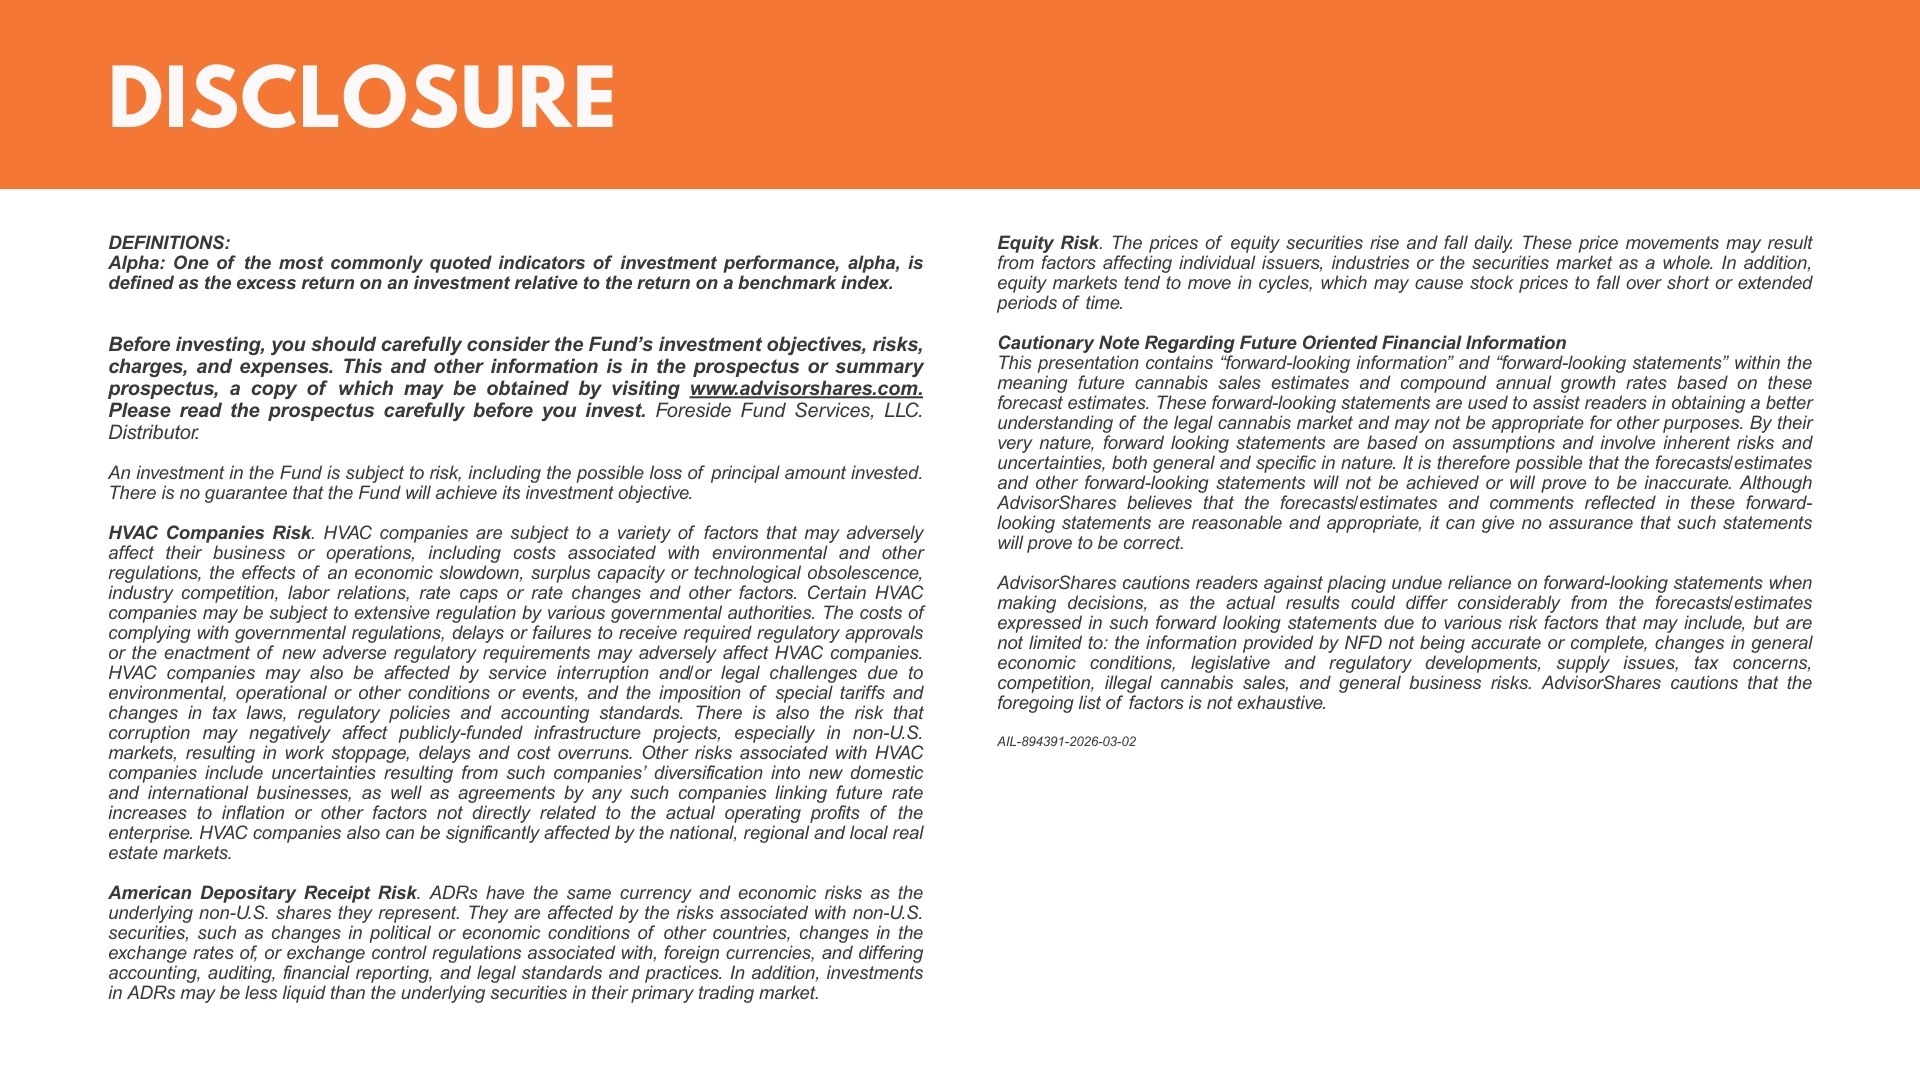
- Before investing, you should carefully consider the Fund’s investment objectives, risks, charges, and expenses. This and other information is in the prospectus or summary prospectus, a copy of which may be obtained by visiting www.advisorshares.com. Please read the prospectus carefully before you invest. Foreside Fund Services, LLC. Distributor.
- An investment in the Fund is subject to risk, including the possible loss of principal amount invested. There is no guarantee that the Fund will achieve its investment objective.
- HVAC Companies Risk. HVAC companies are subject to a variety of factors that may adversely affect their business or operations, including costs associated with environmental and other regulations, the effects of an economic slowdown, surplus capacity or technological obsolescence, industry competition, labor relations, rate caps or rate changes and other factors. Certain HVAC companies may be subject to extensive regulation by various governmental authorities. The costs of complying with governmental regulations, delays or failures to receive required regulatory approvals or the enactment of new adverse regulatory requirements may adversely affect HVAC companies. HVAC companies may also be affected by service interruption and/or legal challenges due to environmental, operational or other conditions or events, and the imposition of special tariffs and changes in tax laws, regulatory policies and accounting standards. There is also the risk that corruption may negatively affect publicly-funded infrastructure projects, especially in non-U.S. markets, resulting in work stoppage, delays and cost overruns. Other risks associated with HVAC companies include uncertainties resulting from such companies’ diversification into new domestic and international businesses, as well as agreements by any such companies linking future rate increases to inflation or other factors not directly related to the actual operating profits of the enterprise. HVAC companies also can be significantly affected by the national, regional and local real estate markets.
- American Depositary Receipt Risk. ADRs have the same currency and economic risks as the underlying non-U.S. shares they represent. They are affected by the risks associated with non-U.S. securities, such as changes in political or economic conditions of other countries, changes in the exchange rates of, or exchange control regulations associated with, foreign currencies, and differing accounting, auditing, financial reporting, and legal standards and practices. In addition, investments in ADRs may be less liquid than the underlying securities in their primary trading market.
- Equity Risk. The prices of equity securities rise and fall daily. These price movements may result from factors affecting individual issuers, industries or the securities market as a whole. In addition, equity markets tend to move in cycles, which may cause stock prices to fall over short or extended periods of time.
- Definitions:
- Alpha: One of the most commonly quoted indicators of investment performance, alpha, is defined as the excess return on an investment relative to the return on a benchmark index.
ETF Social Conversation