HDGE: 3rd Quarter 2025 Portfolio Review
Performance
For the third quarter of 2025, the AdvisorShares Ranger Equity Bear ETF (HDGE) returned -3.43% (NAV) | -3.37% (market) while the S&P 500 Index returned 8.12%.
Top Holdings
| Ticker | Security Description | Portfolio Weight % |
| ERJ | EMBRAER SA-SPON ADR | 5.05% |
| HMY | HARMONY GOLD MNG-SPON ADR | 4.28% |
| GFI | GOLD FIELDS LTD-SPONS ADR | 4.12% |
| CYD | CHINA YUCHAI INTL LTD | 3.89% |
| BBVA | BANCO BILBAO VIZCAYA-SP ADR | 3.88% |
| MUFG | MITSUBISHI UFJ FINL-SPON ADR | 3.60% |
| SE | SEA LTD-ADR | 3.31% |
| VNET | VNET GROUP INC-ADR | 3.16% |
| BCS | BARCLAYS PLC-SPONS ADR | 3.16% |
| SBSW | SIBANYE-STILLWATER LTD-ADR | 3.02% |
As of 09.30.2025. Cash not included. Holdings subject to change.
Markets Review
/The market has worked off its deeply oversold conditions experienced earlier in the year. As a result, the fund is more aggressively positioned due to nosebleed valuations, poor market breadth, and activity reminiscent of prior late-stage markets.
According to Vettafi/Advisor Perspectives, four primary valuation indicators are well above their geometric means. For example, the cyclical P/E 10 ratio is 117% above its geometric average. In all, the indicators are 155% above average.
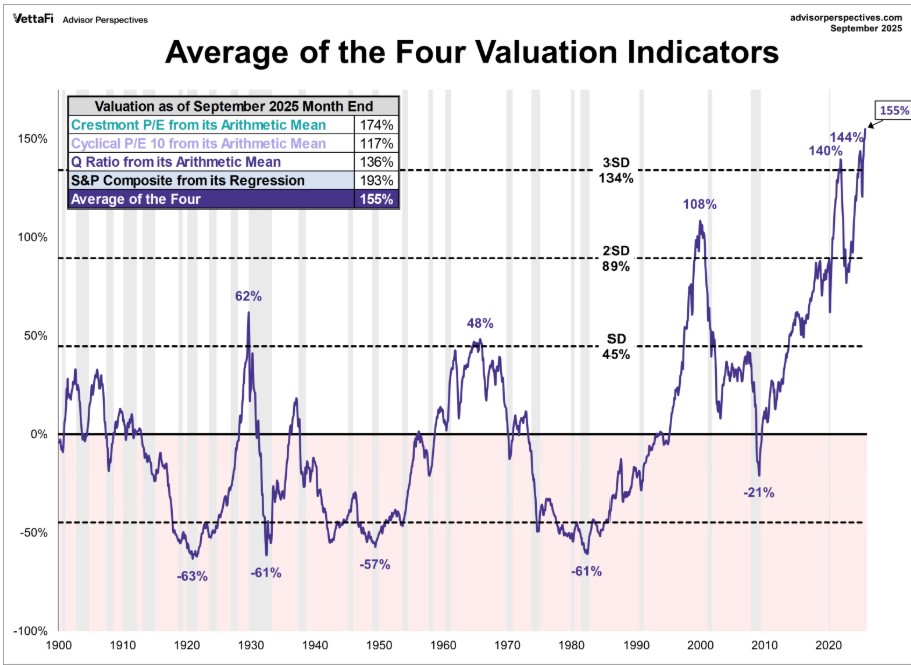
Source: VettaFi / AdvisorsPerspective; as of 09/30/2025.
AQR, a $100 billion asset manager, recently published a report highlighting that top quintile cyclical P/E ratios have been met with 10-year forward returns of just 3% annually.
The cyclically adjusted P/E ratio of the U.S. is the highest of any primary market in the world today.
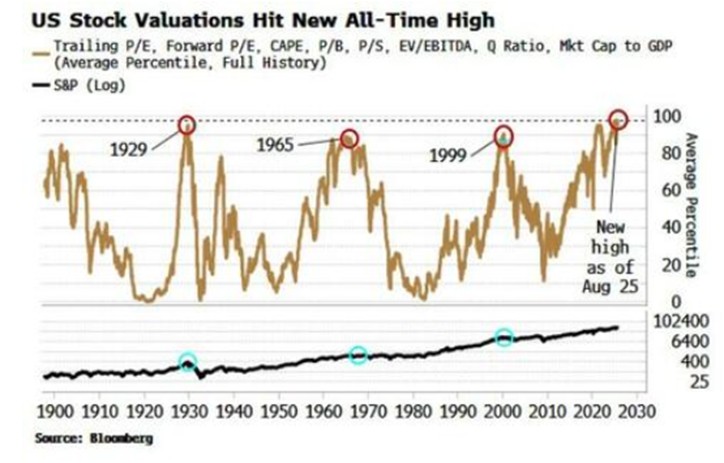
Source: Bloomberg; as of 08/25/2025.
Another way to look at it is that the average percentile of key valuation metrics is at an all-time high.
As a result, the the equity risk premium in the S&P 500 is at a 20-year low.
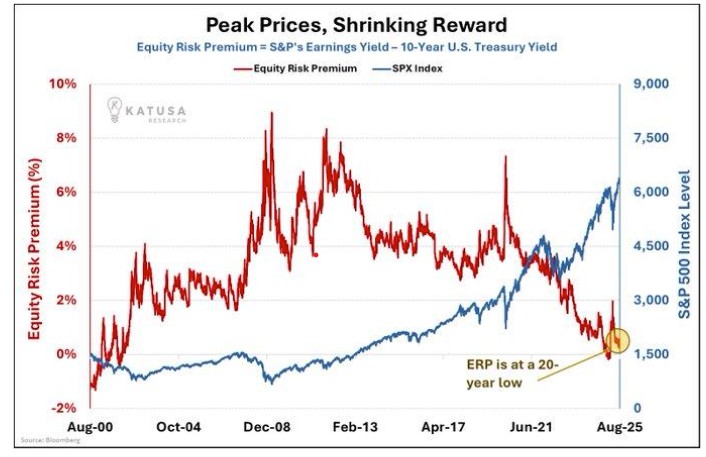
Source: Katusa Research; 08/25/2025.
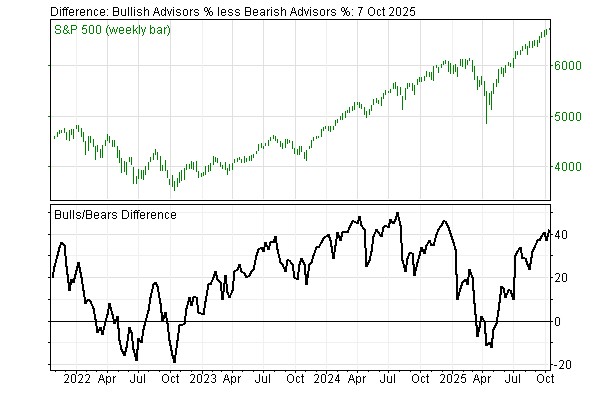
Meanwhile, market sentiment is too bullish, in our view. The Investors’ Intelligence Advisors’ Survey shows a bull/bear spread of over 42%.
As they note, “The bull-bear spread expanded to +42.3%, from +37.0% last time, the second reading in the danger zone above +40% over the last three weeks. The spread is near the Dec-2024 count, which just exceeded 45%! We considered counts above 35% as cautionary, and this is a further warning. Sentiment signals are early, and the spring 2025 decline occurred a few months after the peak spread. That selloff resulted in eight negative differences (more bears than bulls), with two weeks in Apr at -11.0 or below. Those were the first negative spreads since the fall 2022 lows. Negative differences signal diminished risk and allow for broad buying the wider they get.”
 .
.
Source: Investors’ Intelligence Advisors’ Survey; as of 10/07/2025.
As a result of over-optimism and historically elevated valuations, we expect the portfolio to remain aggressively short for the foreseeable future.
Respectfully,
![]()
![]()

Brad Lamensdorf Jon DelVecchio
Ranger Alternative Management
AdvisorShares Ranger Equity Bear ETF (HDGE) Co-Portfolio Managers
Past Commentary
Definitions:
P/E 10 ratio – a valuation indicator, commonly used with major equity indexes, factoring in real per-share earnings over a 10-year period. It is also known as the cyclically adjusted price earnings ratio.
Crestmont P/E ratio – a valuation metric that compares the price of a stock or the overall market to its earnings, specifically using the average earnings over a ten-year period.
Q Ratio – a valuation method that divide the market value of a company by the replacement value of the firm’s assets; also known as Tobin’s Q.
Equity risk premium – represents the additional return stocks offer over risk-free investments like Treasury bills, compensating investors for higher risks.
The S&P 500 Index is a free-float capitalization-weighted index based on the common stock prices of 500 American companies. It is one of the most commonly followed equity indices and many consider it the best representation of the market and a bellwether for the U.S. economy.
A Bear Market (Bearish) is a market condition in which the prices of securities are falling, and widespread pessimism causes the negative sentiment to be self-sustaining. As investors anticipate losses in a bear market and selling continues, pessimism only grows. Although figures can vary, for many, a downturn of 20% or more in multiple broad market indexes, such as the Dow Jones Industrial Average (DJIA) or Standard & Poor’s 500 Index (S&P 500), over at least a two-month period, is considered an entry into a bear market.
A Bull Market (Bullish) is a financial market of a group of securities in which prices are rising or are expected to rise. The term “bull market” is most often used to refer to the stock market, but can be applied to anything that is traded, such as bonds, currencies and commodities.
The Dow Jones Industrial Average (DJIA) is a stock market index of 30 prominent companies listed on stock exchanges in the United States. The DJIA is one of the oldest and most commonly followed equity indexes.
The Nasdaq 100 Index is a stock index of the 100 largest companies by modified market capitalization trading on Nasdaq exchanges, excluding companies in the financial sector.
A short position is the sale of a borrowed investment with the expectation that it will decline in value.
Volatility is a statistical measure of the dispersion of returns for a given security or market index. Volatility can either be measured by using the standard deviation or variance between returns from that same security or market index. Commonly, the higher the volatility, the riskier the security.
Implied Volatility is the estimated volatility of a security’s price. In general, implied volatility increases when the market is bearish and decreases when the market is bullish. This is due to the common belief that bearish markets are more risky than bullish markets.
The Volatility Index (VIX) is the ticker symbol for the Chicago Board Options Exchange (CBOE) Volatility Index, which shows the market’s expectation of 30-day volatility. It is constructed using the implied volatilities of a wide range of S&P 500 index options. This volatility is meant to be forward looking and is calculated from both calls and puts. The VIX is a widely used measure of market risk and is often referred to as the “investor fear gauge”. The VIX is a contrarian sentiment indicator that helps to determine when there is too much optimism or fear in the market.
Before investing you should carefully consider the Fund’s investment objectives, risks, charges and expenses. This and other information is in the prospectus or summary prospectus, a copy of which may be obtained by visiting www.advisorshares.com. Please read the prospectus carefully before you invest. Foreside Fund Services, LLC, distributor.
There is no guarantee that the Fund will achieve its investment objective. An investment in the Fund is subject to risk, including the possible loss of principal amount invested. The Fund may invest in (or short) ETFs, ETNs and ETPs. In addition to the risks associated with such vehicles, investments, or reference assets in the case of ETNs, lack of liquidity can result in its value being more volatile than the underlying portfolio investment. Other Fund risks include market risk, equity risk, short sales and leverage risk, large cap risk, early closing risk, liquidity risk and trading risk. Short sales involve leverage because the Fund borrows securities and then sells them, effectively leveraging its assets. The use of leverage may magnify gains or losses for the Fund. See prospectus for specific risks and details.
Shares are bought and sold at market price (closing price) not NAV and are not individually redeemed from the Fund. Market price returns are based on the midpoint of the bid/ask spread at 4:00 pm Eastern Time (when NAV is normally determined), and do not represent the return you would receive if you traded at other times.
Holdings and allocations are subject to risks and change.
The views in this commentary are those of the portfolio manager and many not reflect his views on the date this material is distributed or any time thereafter. These views are intended to assist shareholders in understanding their investments and do not constitute investment advice.