
| Symbol | Exchange | Inception Date | CUSIP | NAV | Options Available |
|---|---|---|---|---|---|
| QPX | NYSE Arca | 12/28/2020 | 00768Y 438 | QPX.NV | Yes |
About The ETF
About QPX’s Quantitative Model
About the Implied Volatility Index (TIX™)
Why Invest in QPX?
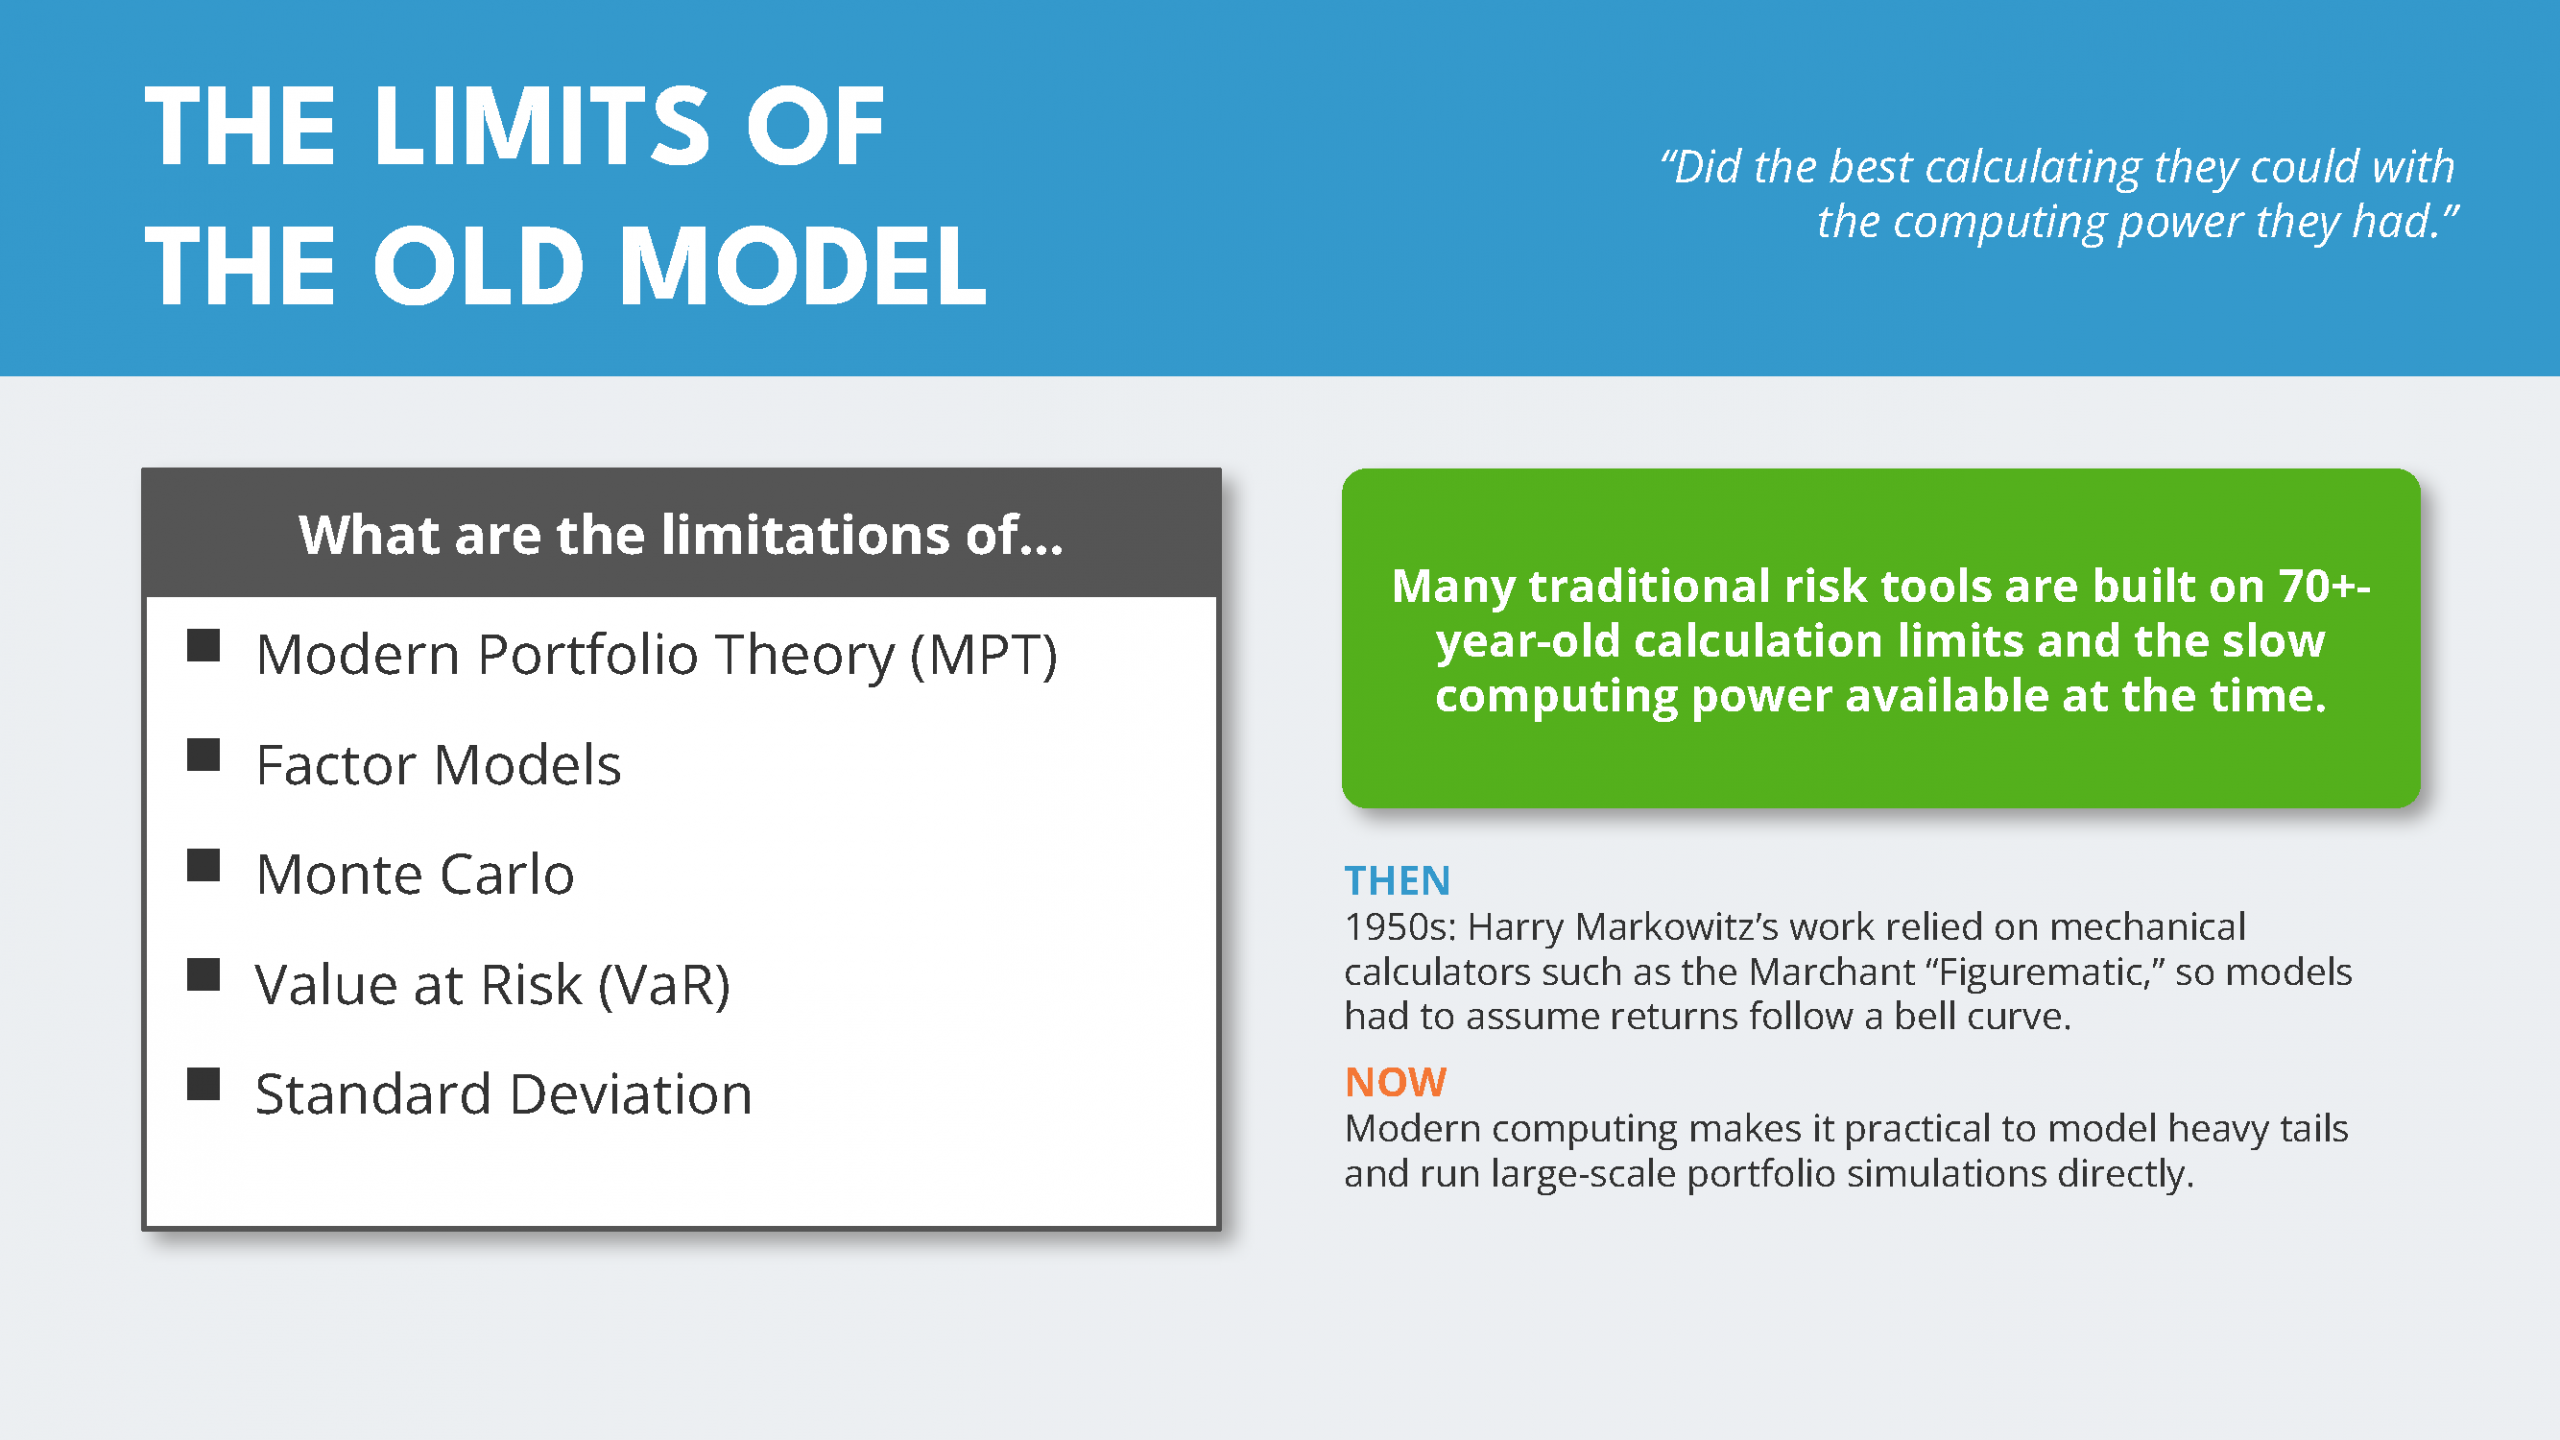
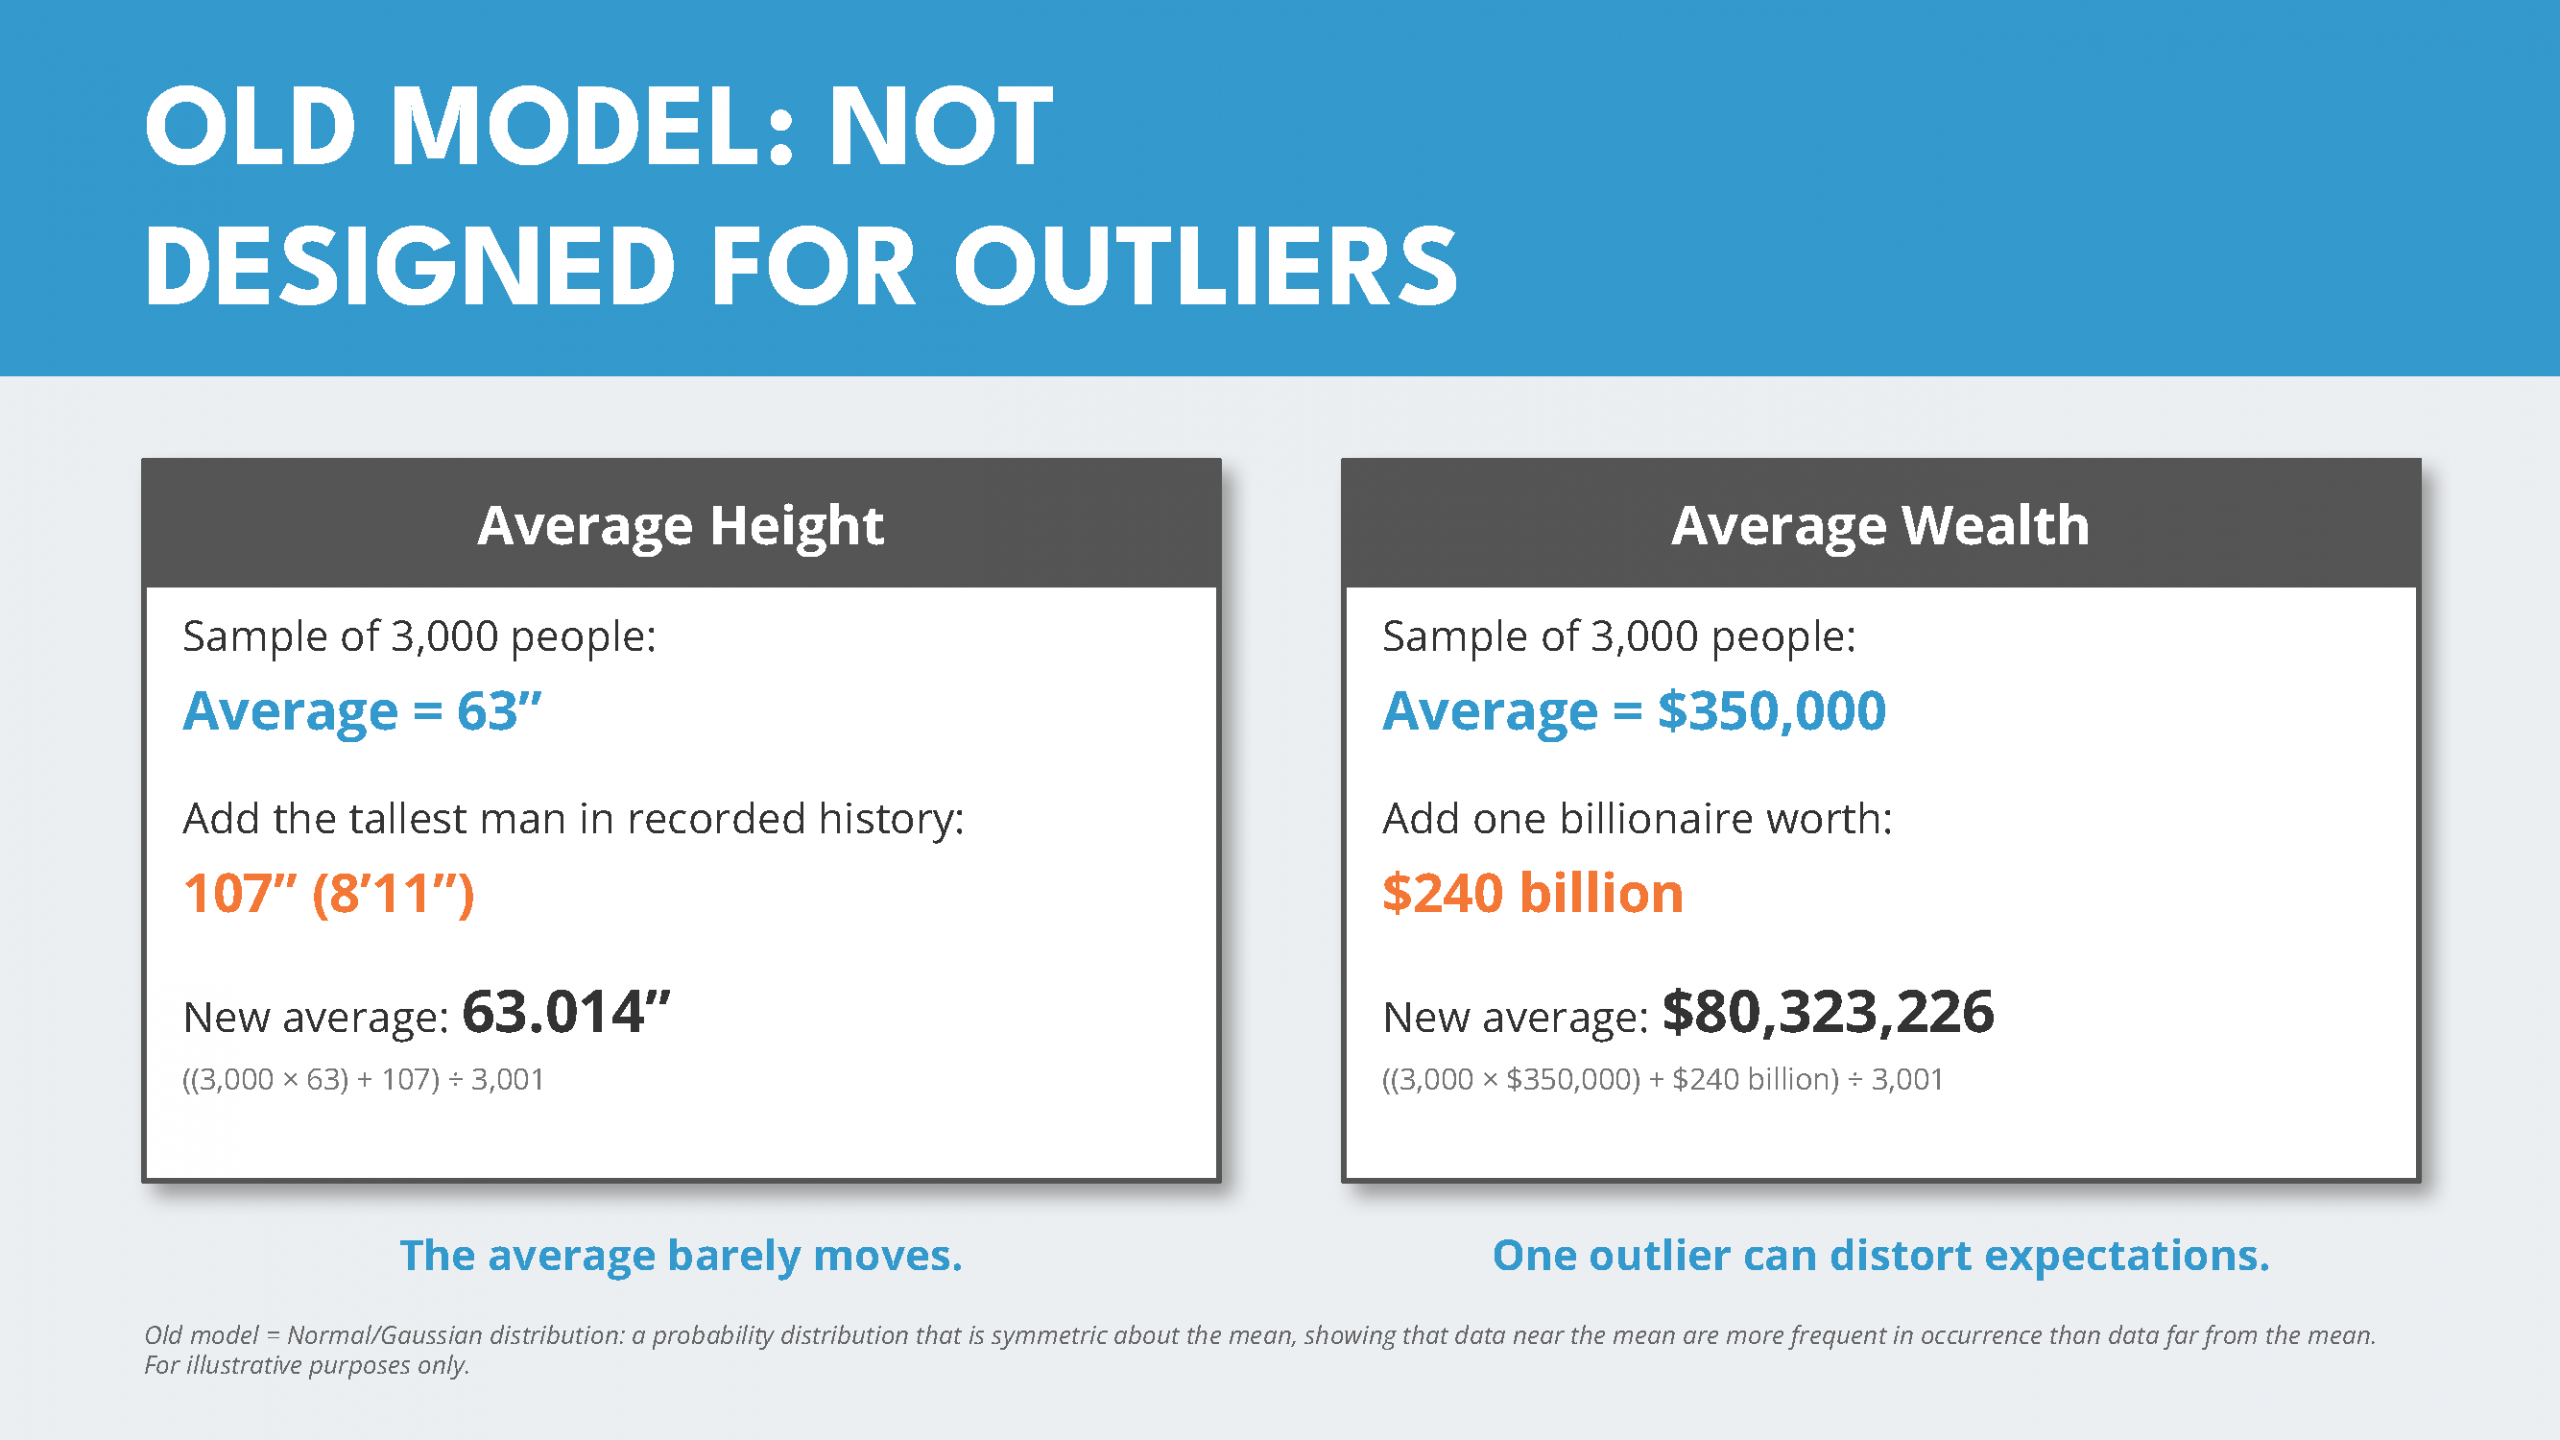
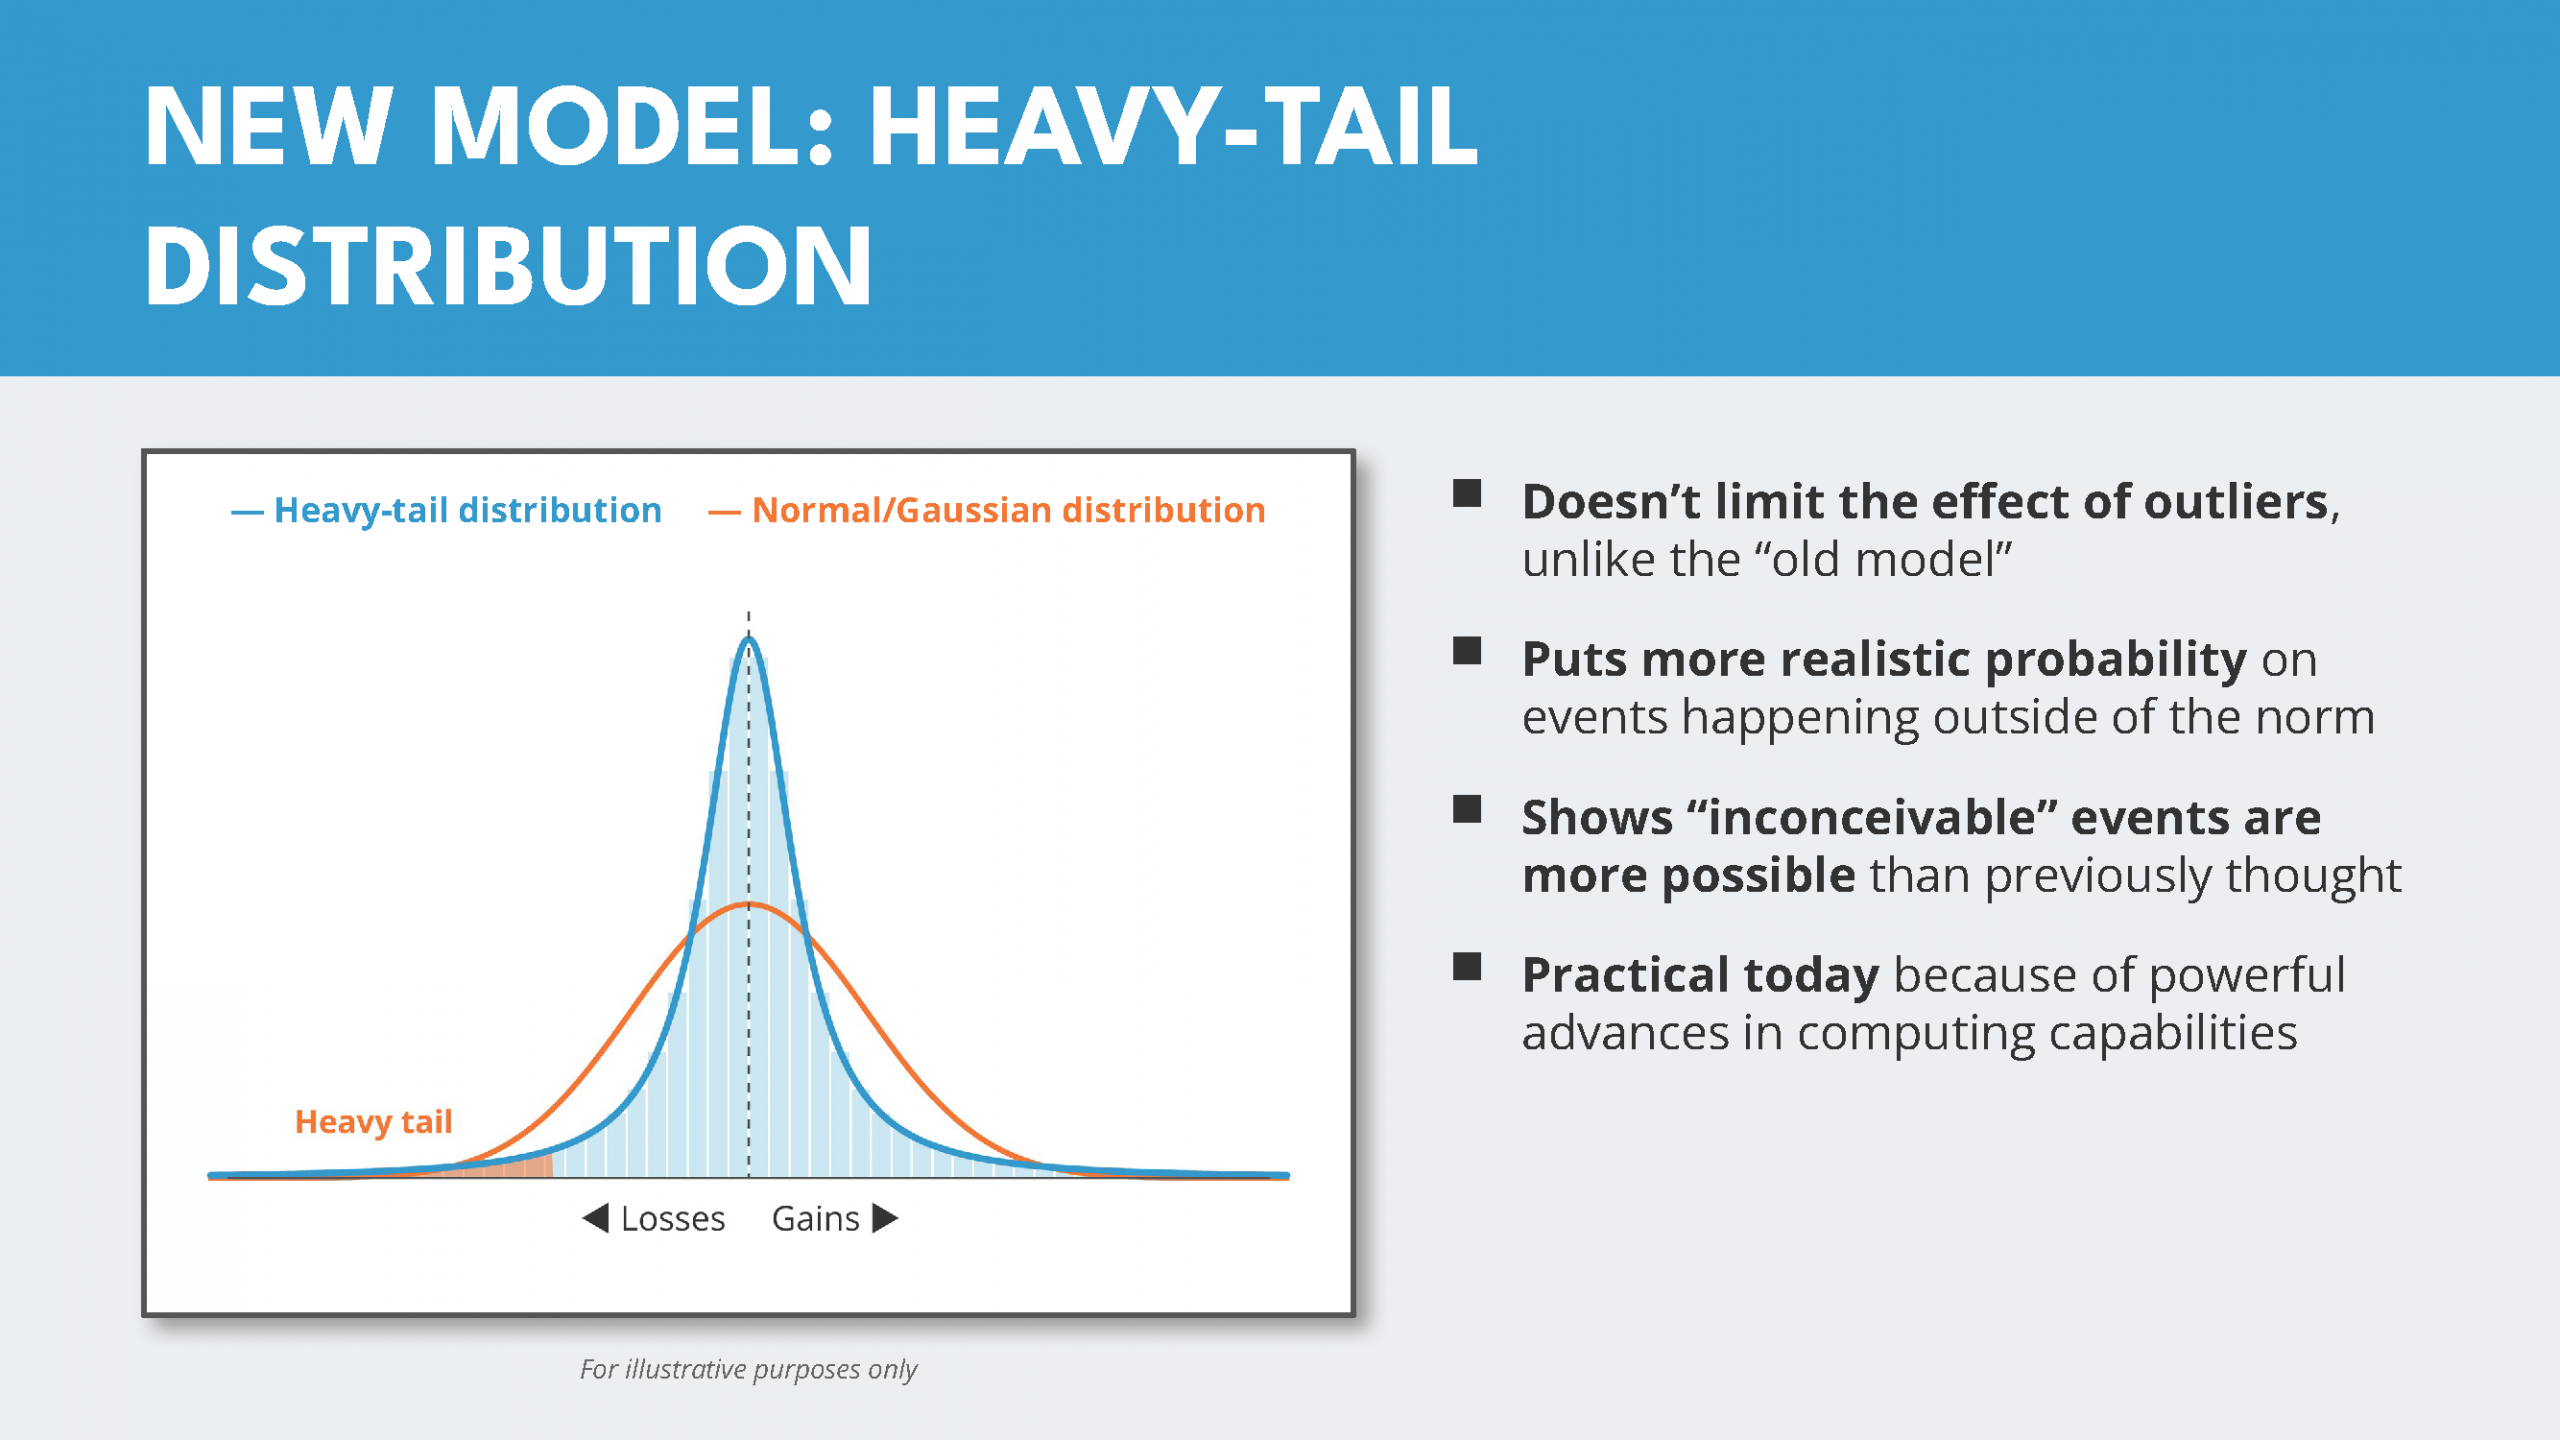
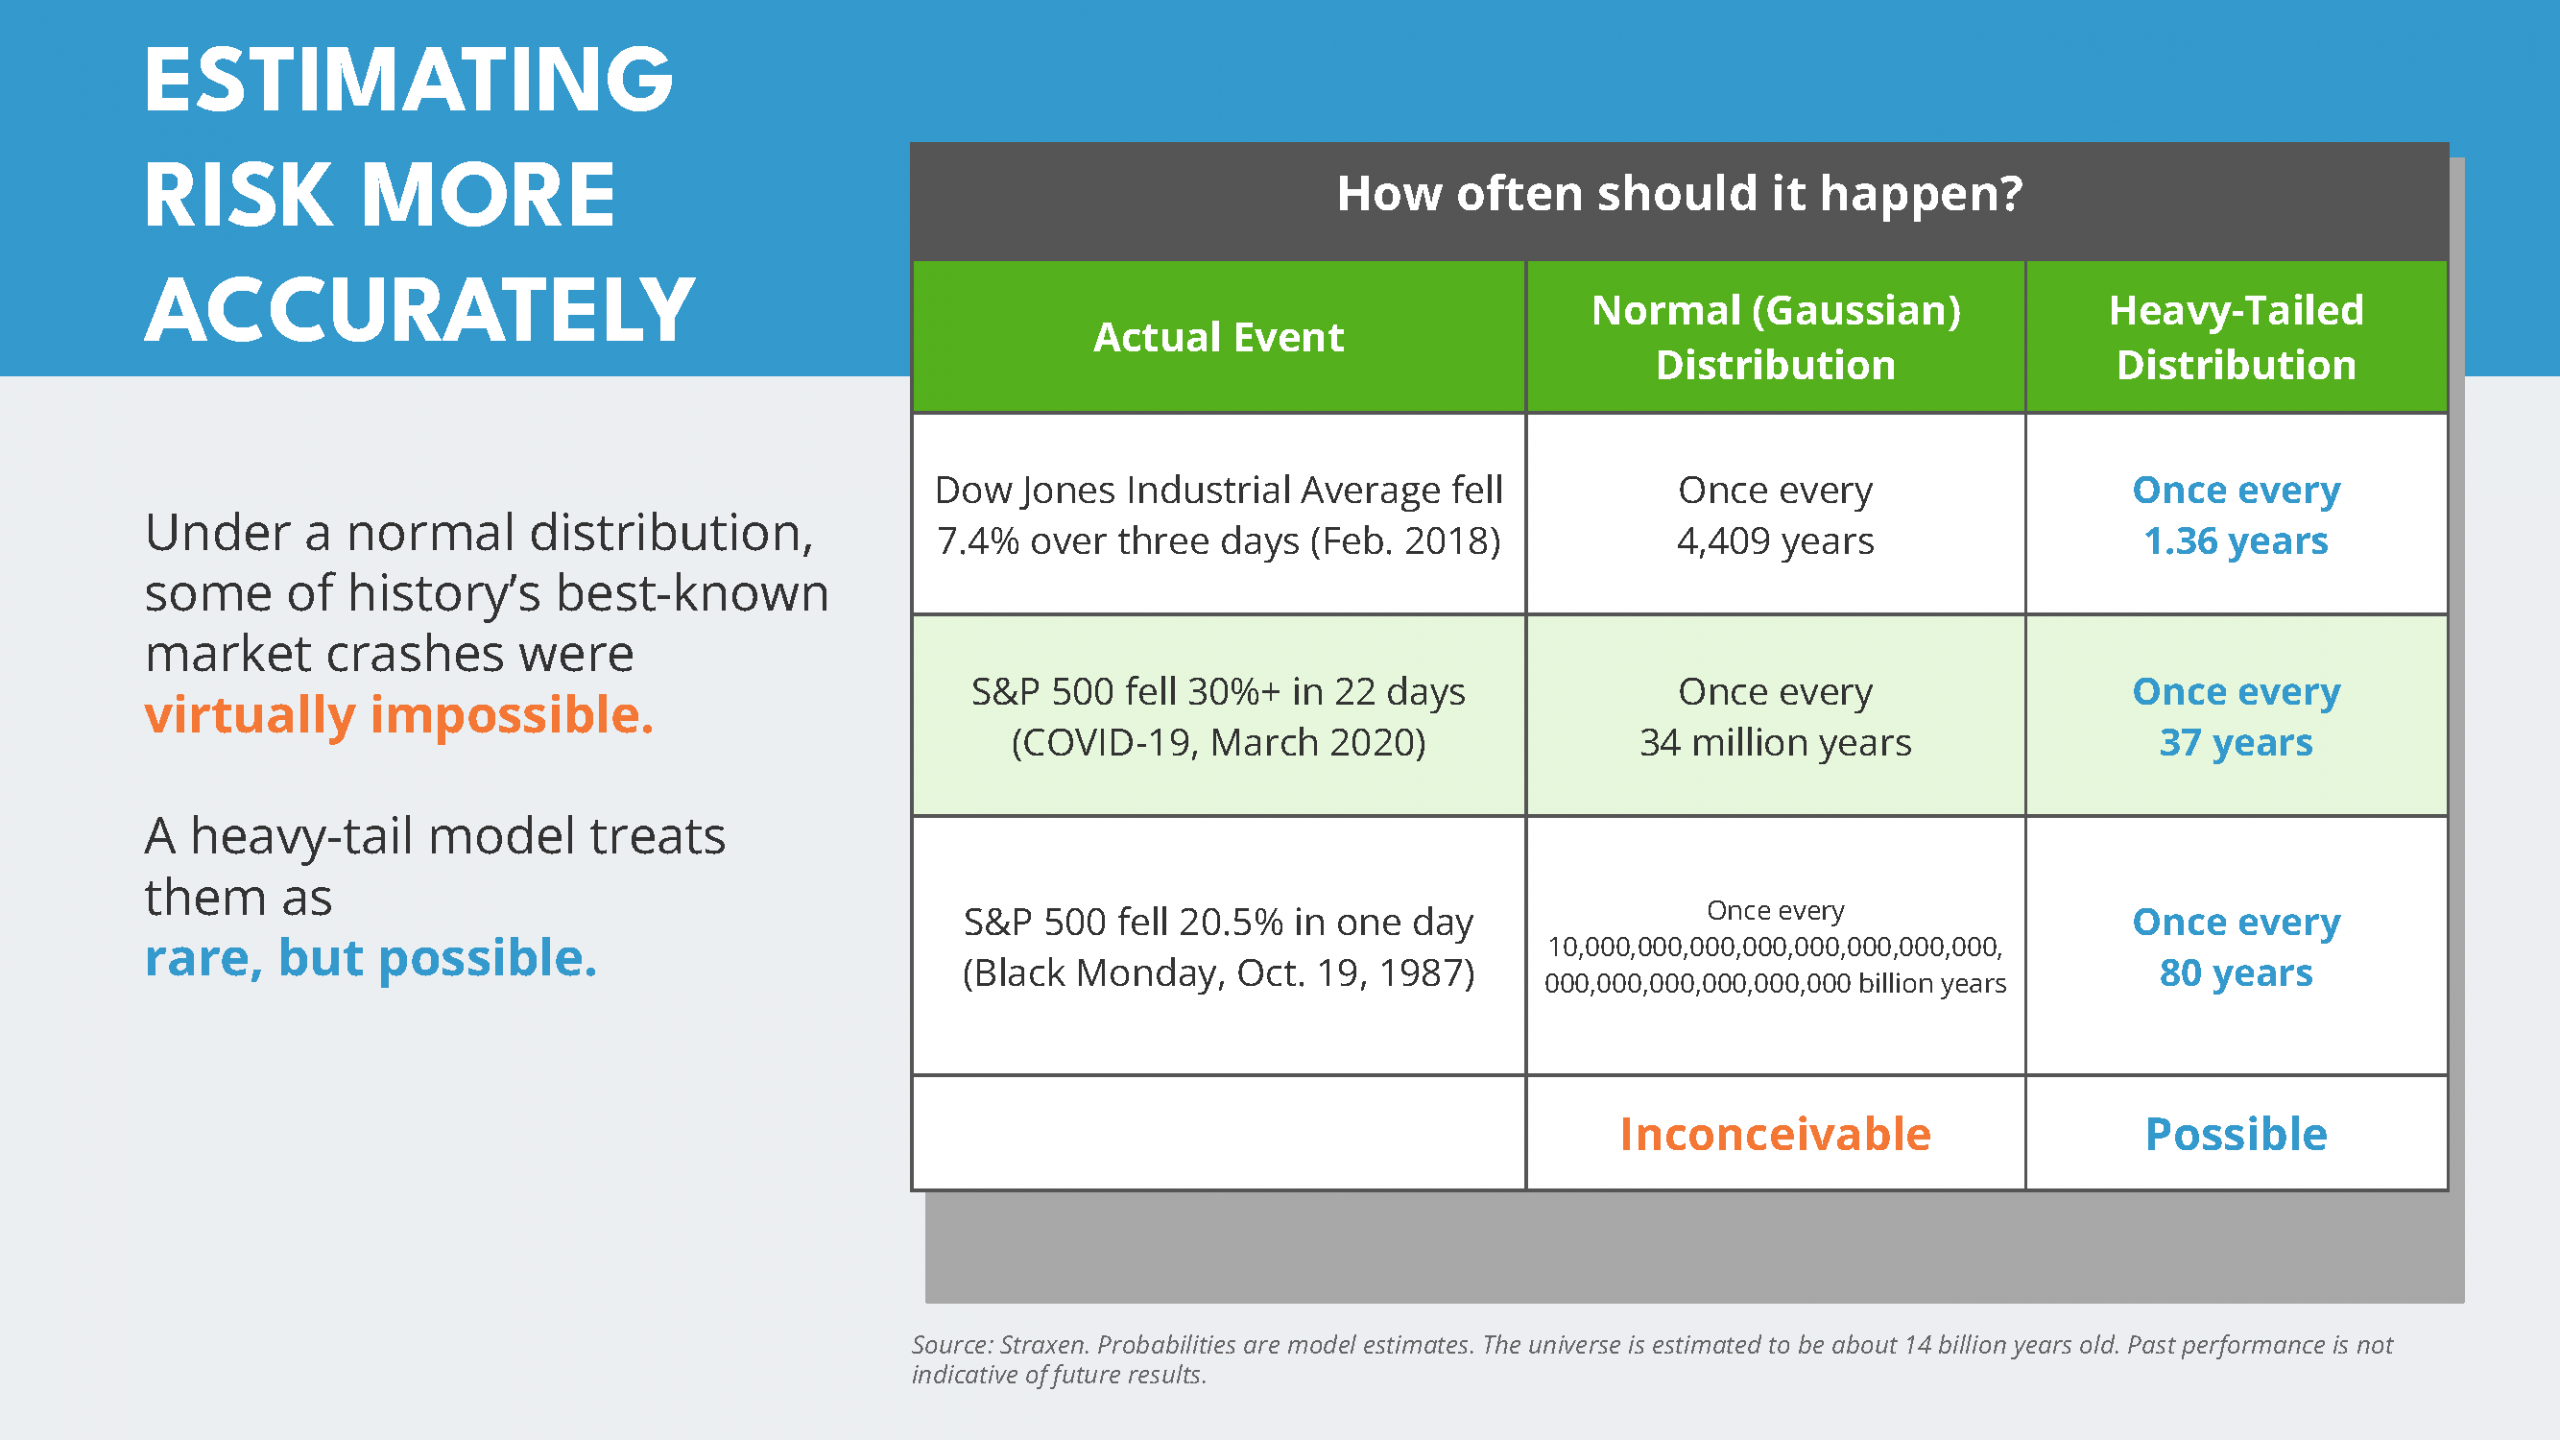
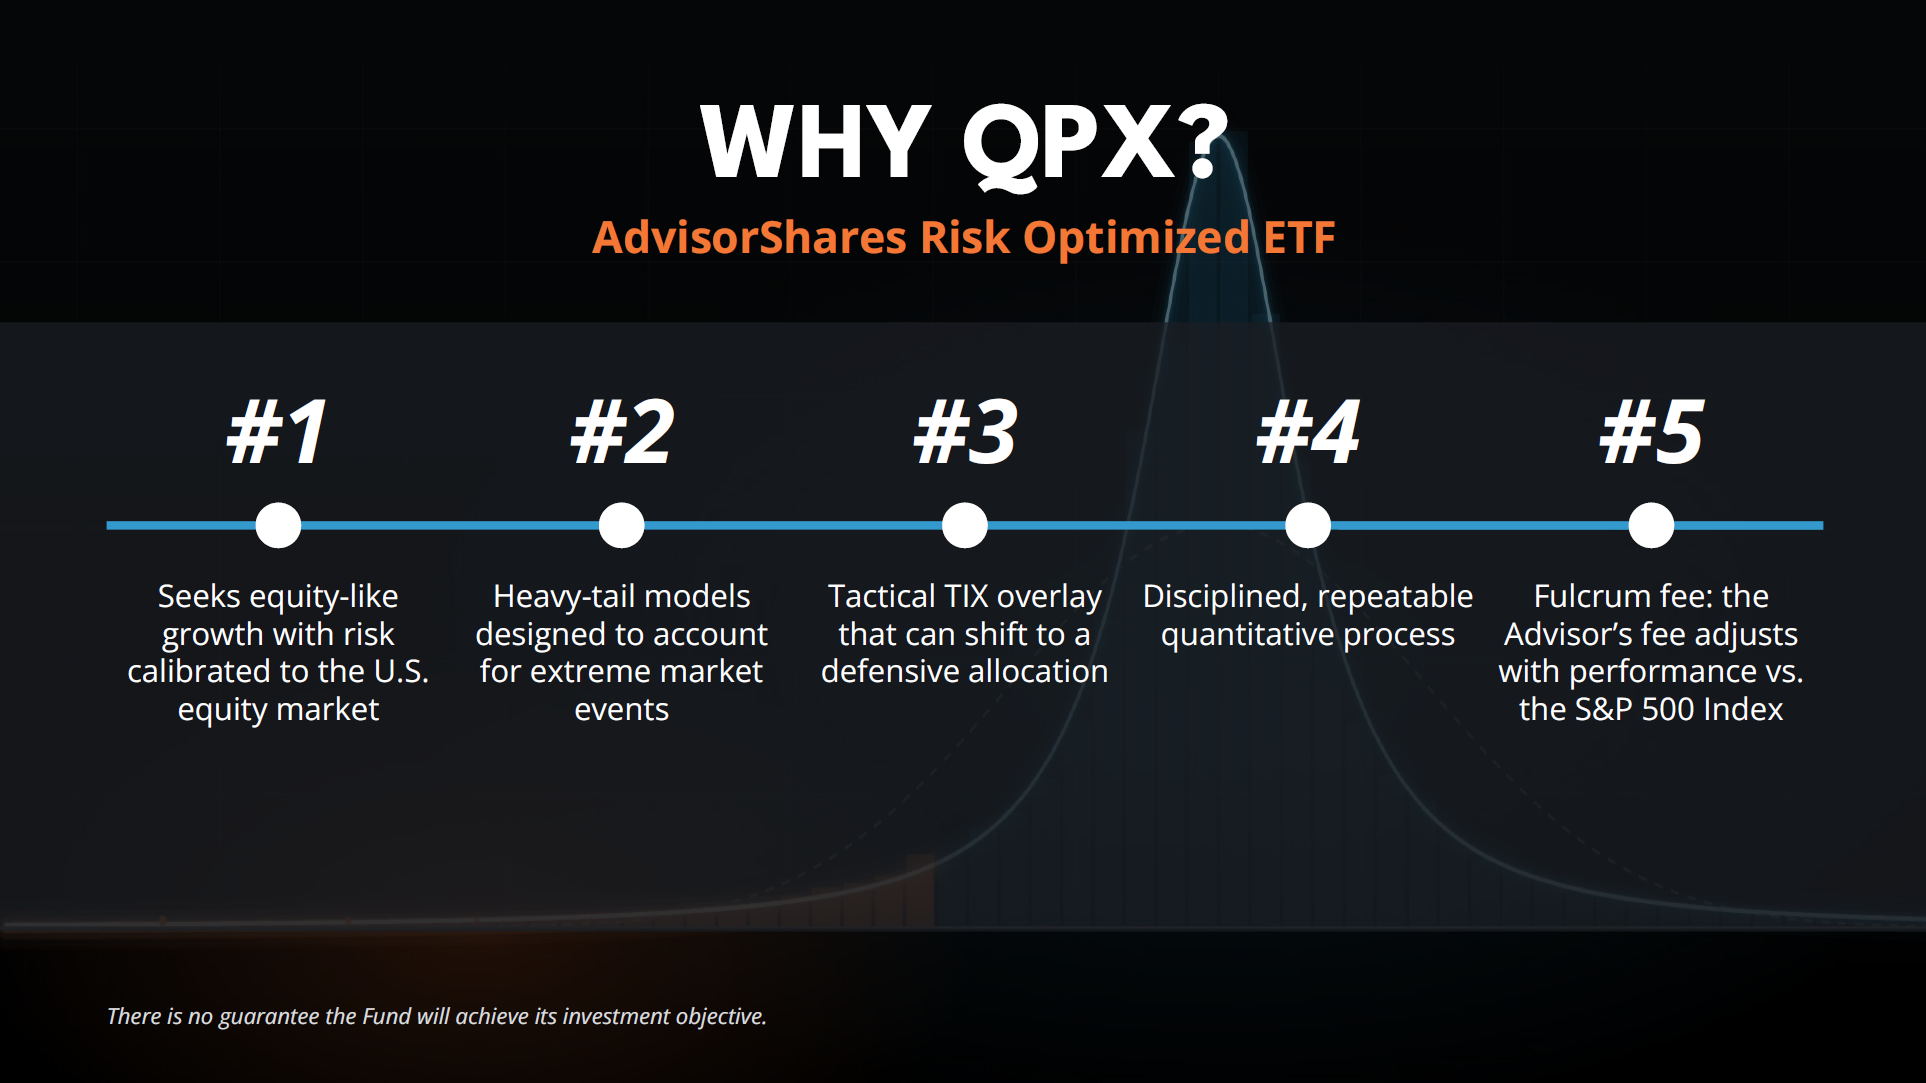
- Heavy-Tail Risk Modeling – Recognizing the limitations of Modern Portfolio Theory and other bell curve or Gaussian-based analysis, QPX’s quantitative model focuses on heavy-tail risk models in an effort to more accurately represent the frequency and impact of severe losses in financial markets and to optimize risk accordingly.
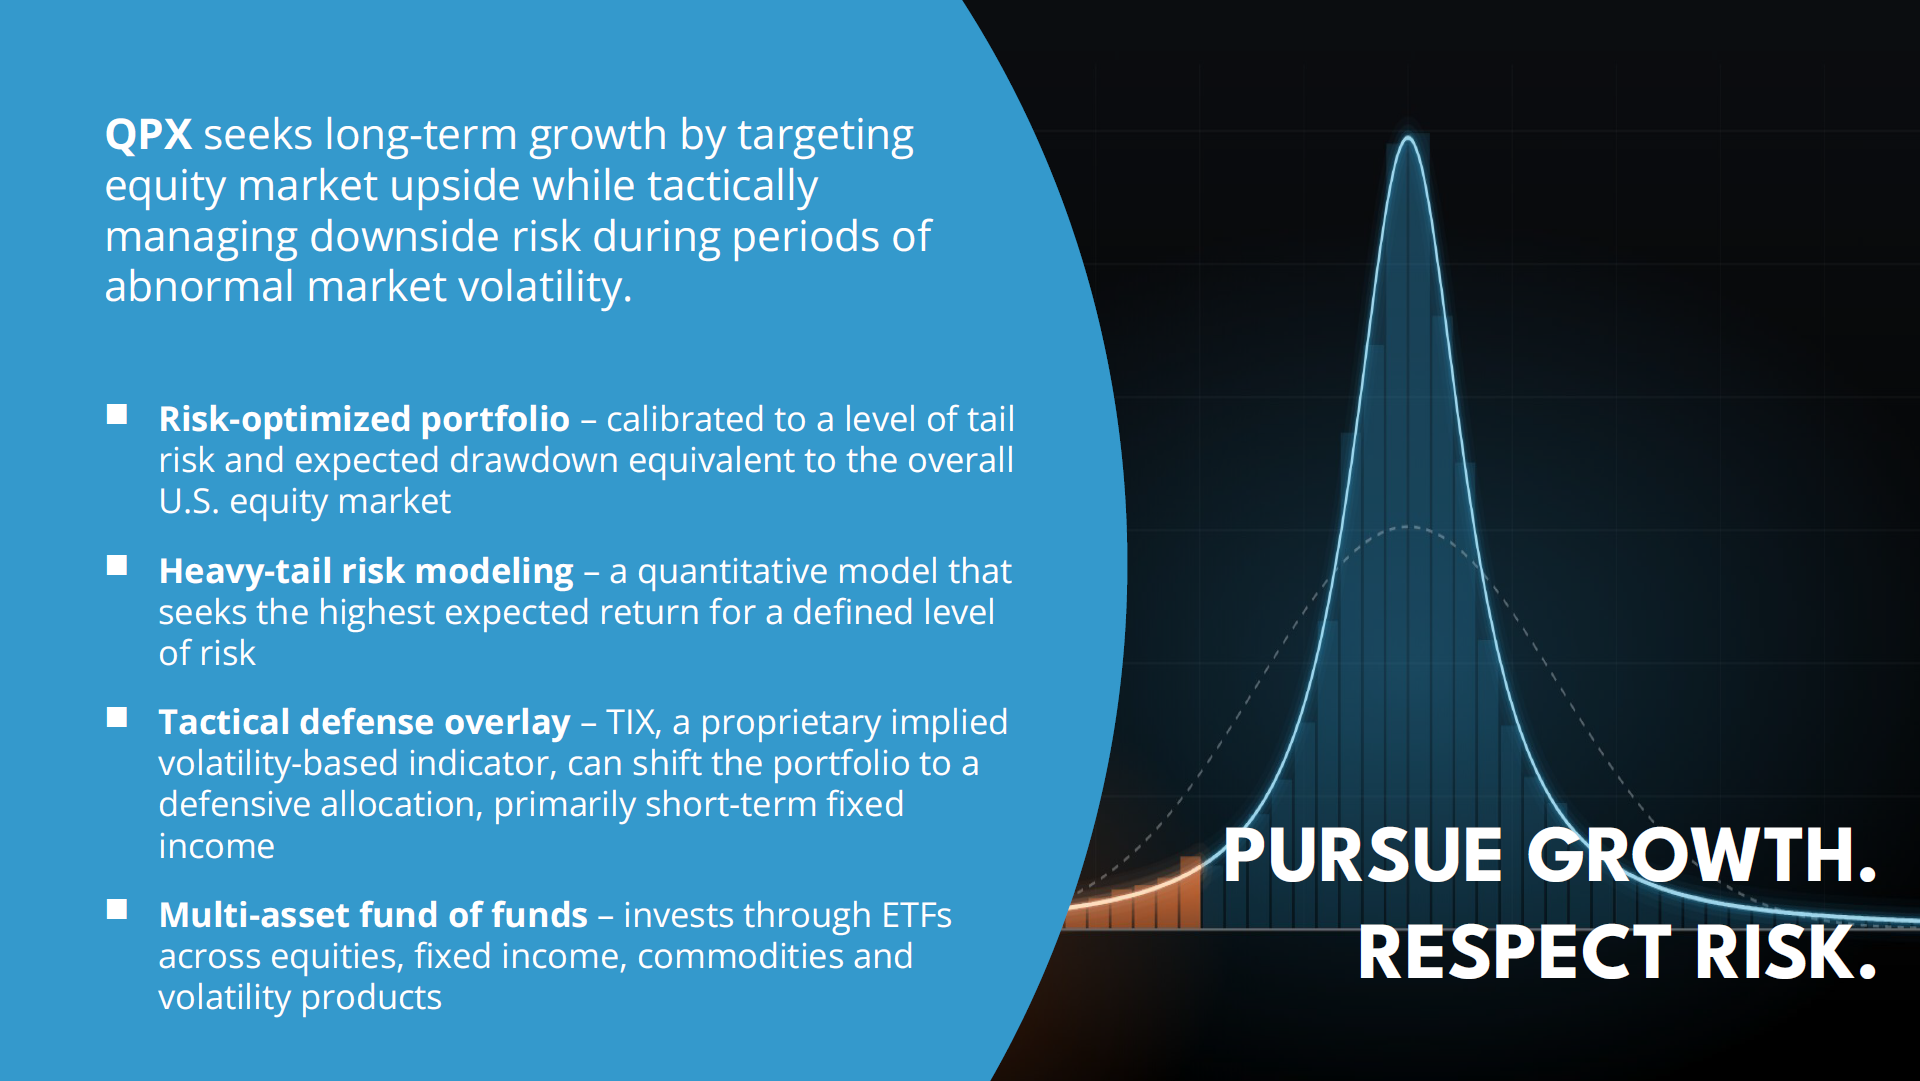
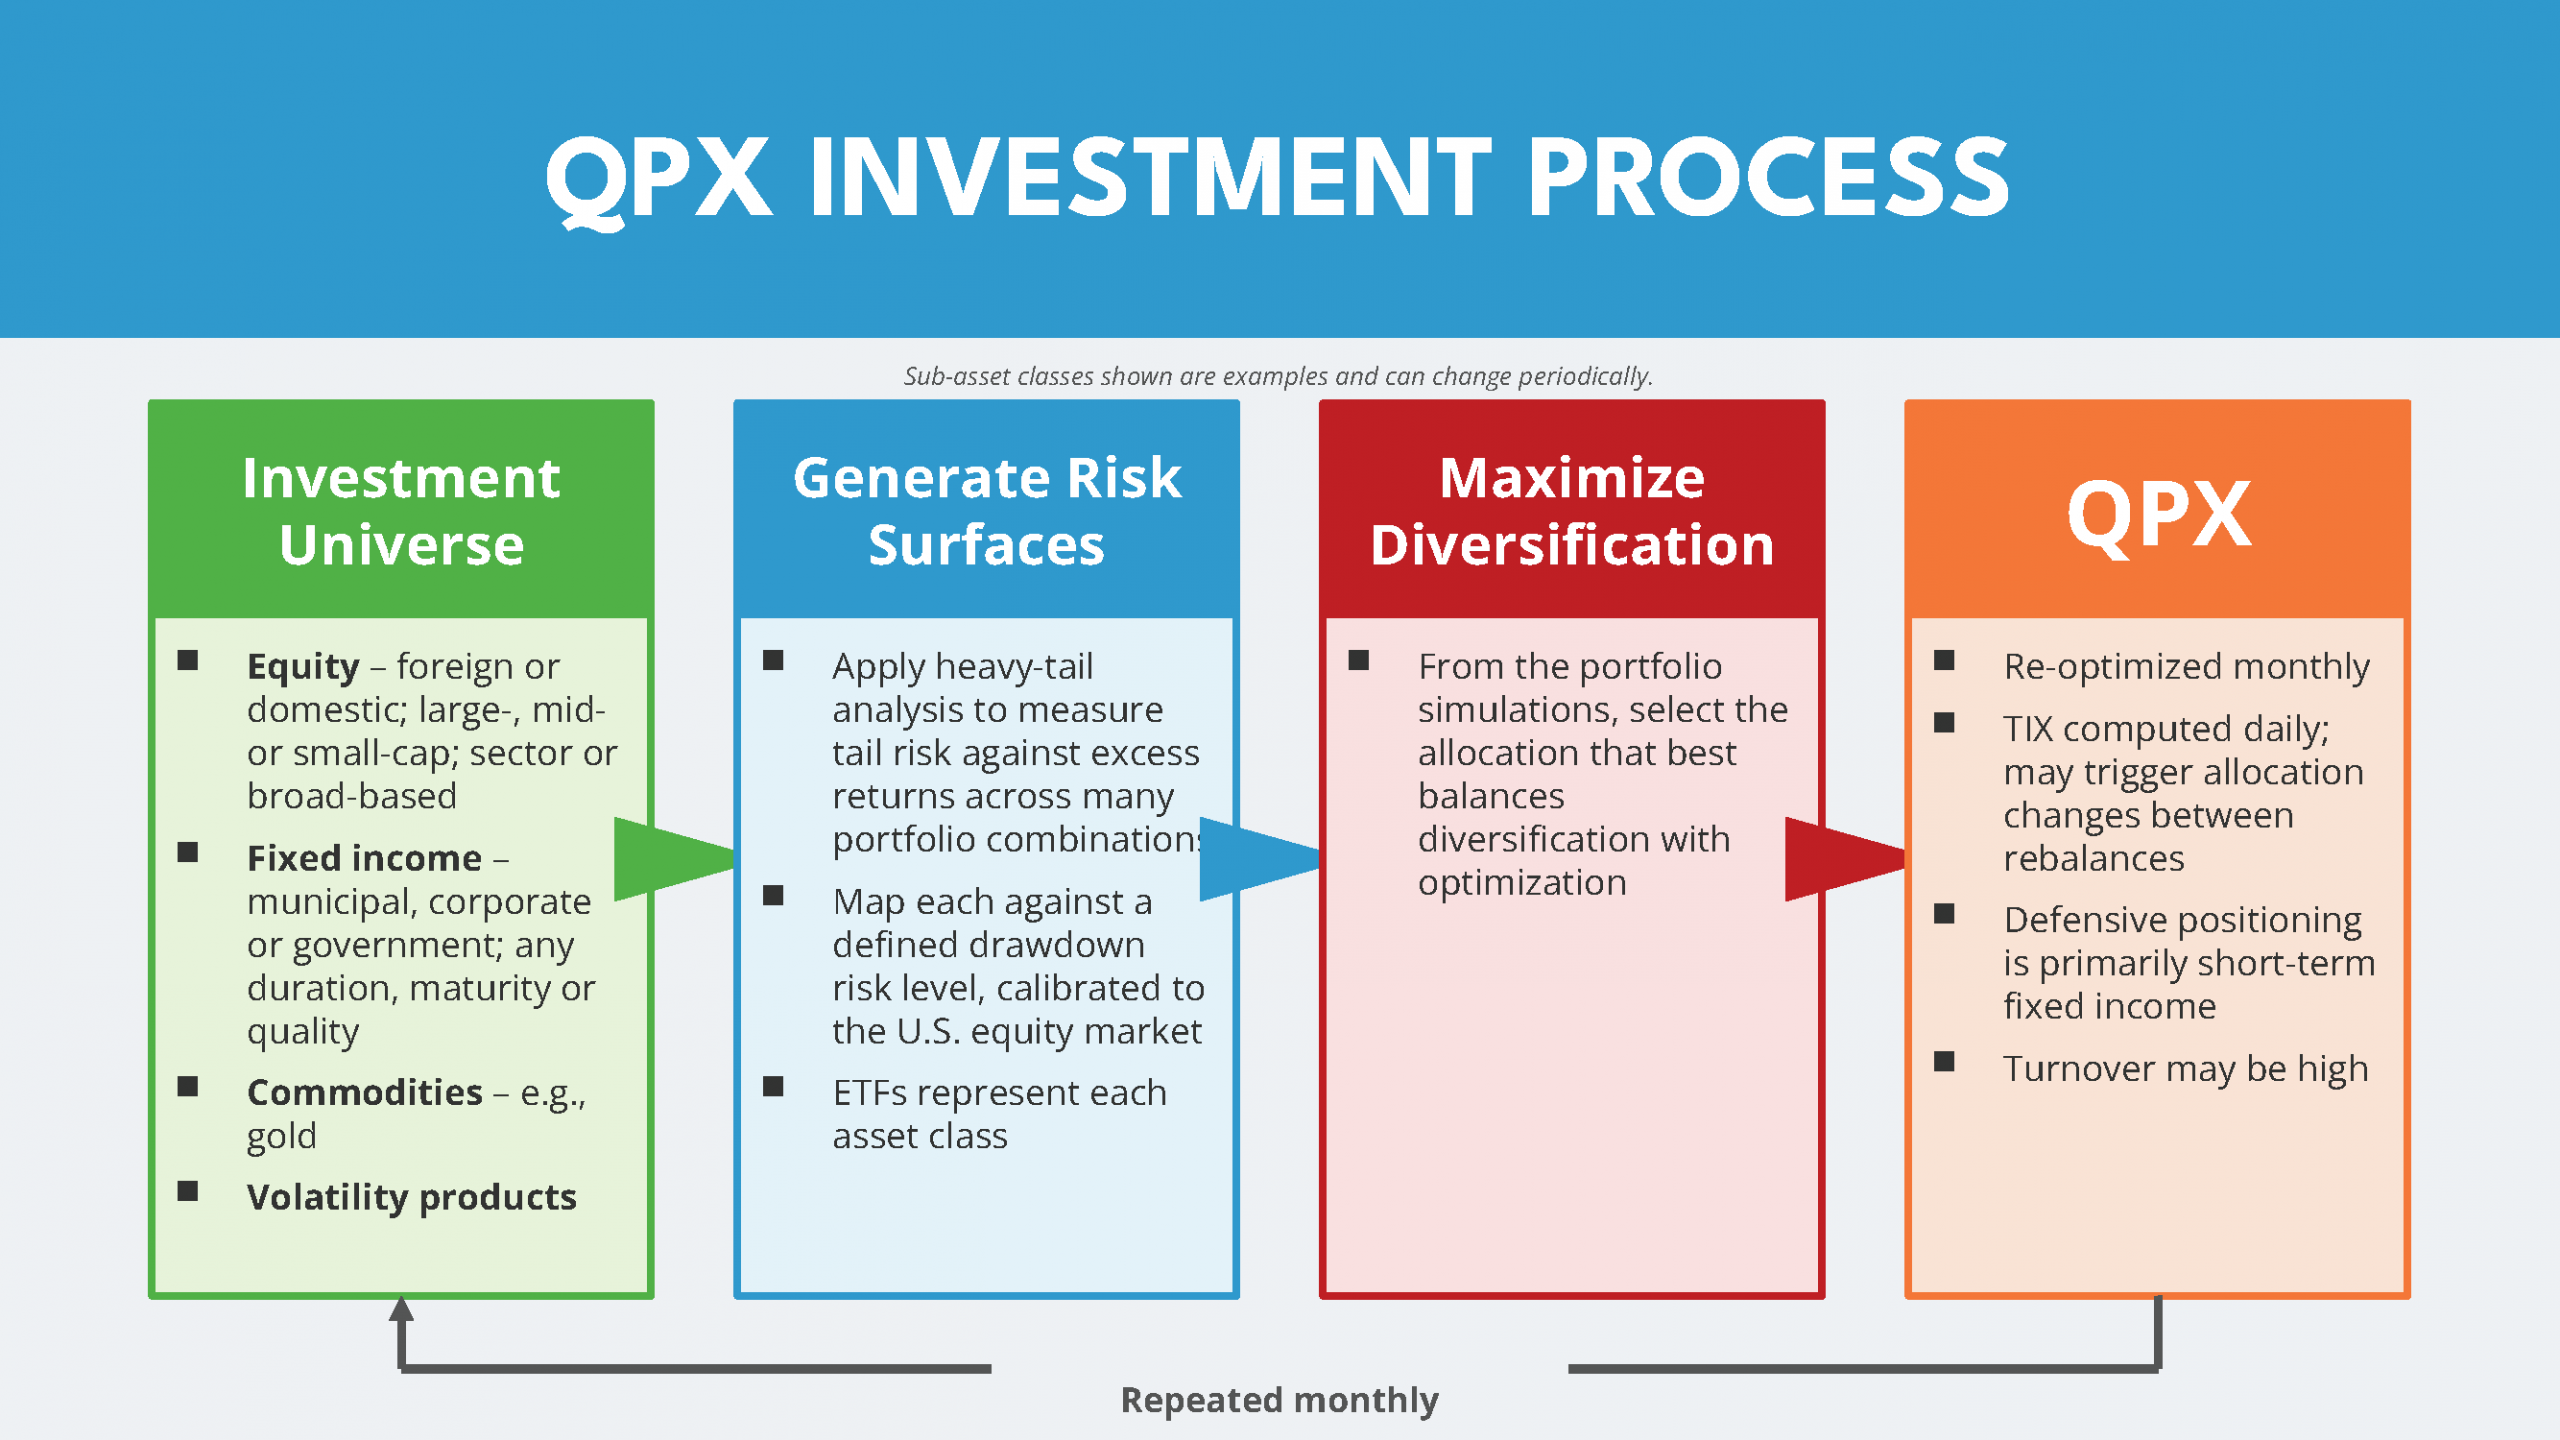
- Risk-First Portfolio Construction – QPX’s quantitative model uses modern financial theory and computing power to analyze tens of thousands of potential portfolio simulations and aims to identify the allocation which offers the highest expected return for a defined level of risk.
- Flexible Multi-Asset Portfolio – Utilizes a broad range of asset classes, including equities, fixed income, commodities and volatility products, in an effort to balance the portfolio and reduce risk concentration.
- Fulcrum Fee Structure – The Advisor’s management fee is directly tied to the fund’s performance relative to the S&P 500 Index over a rolling 12-month period. The 1.00% base fee may adjust up or down by up to 0.10%, so outperformance results in a higher management fee (up to 1.10%) while underperformance results in a lower management fee (down to 0.90%).
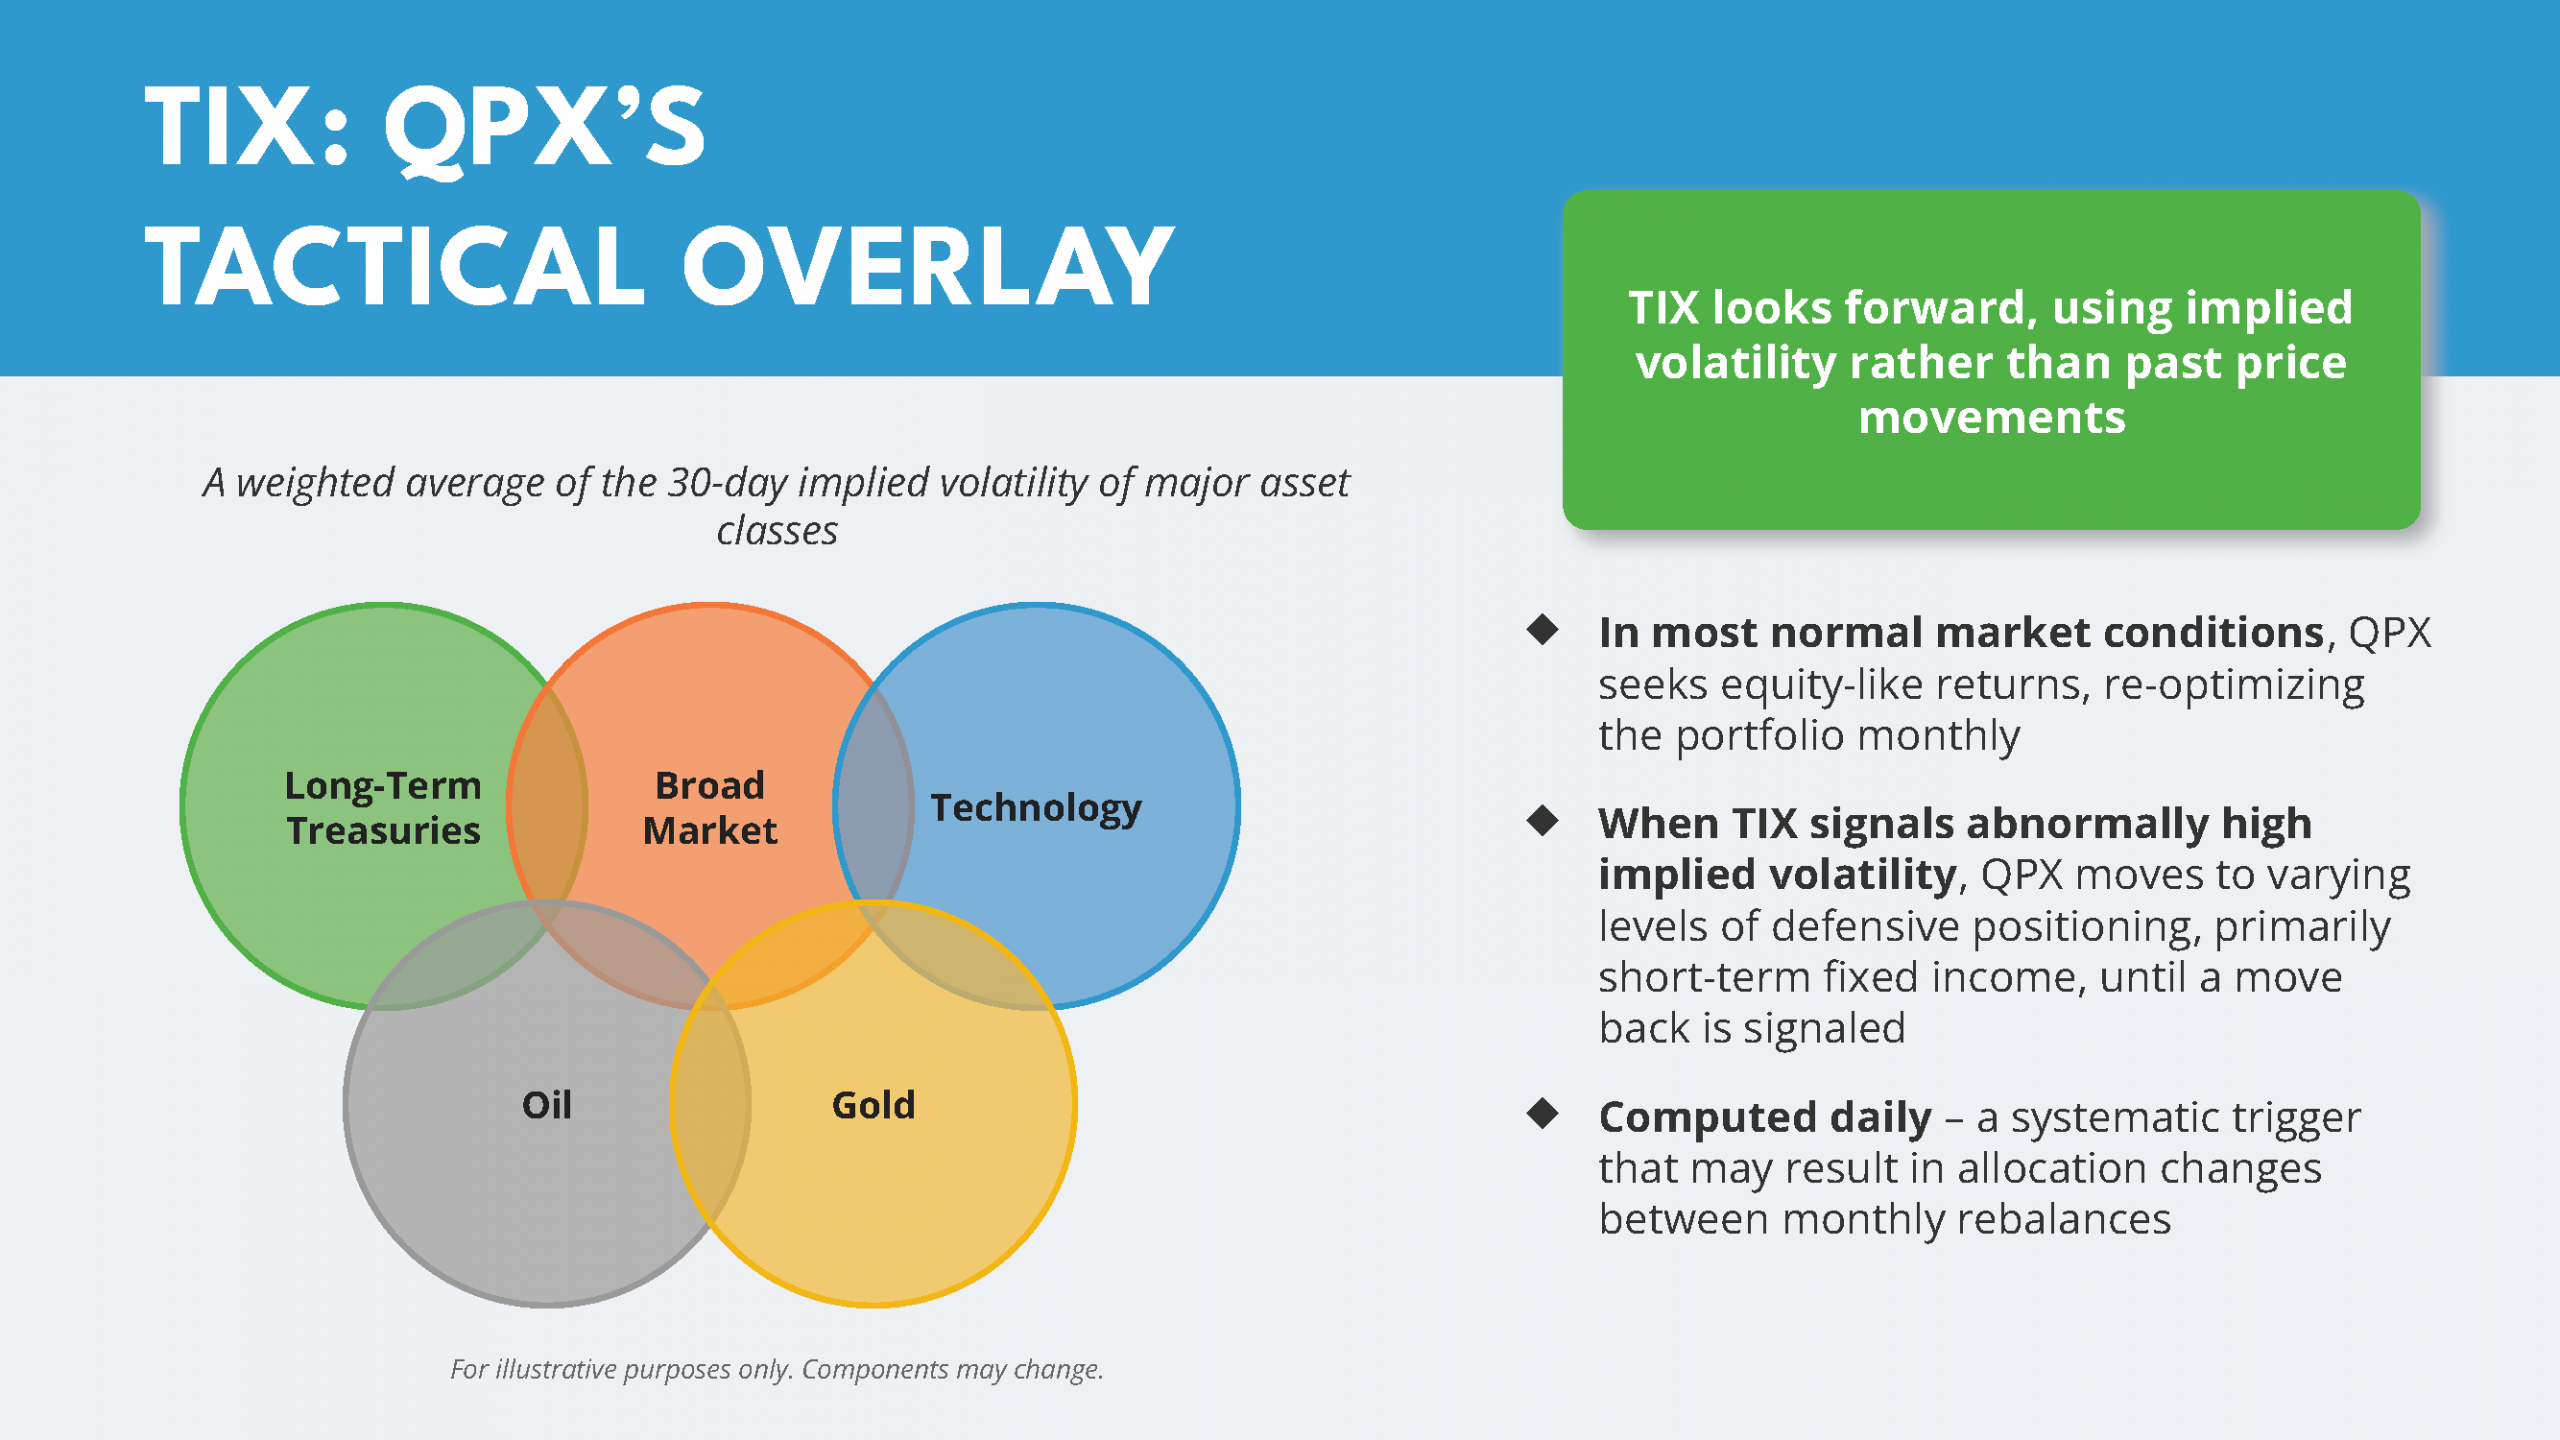
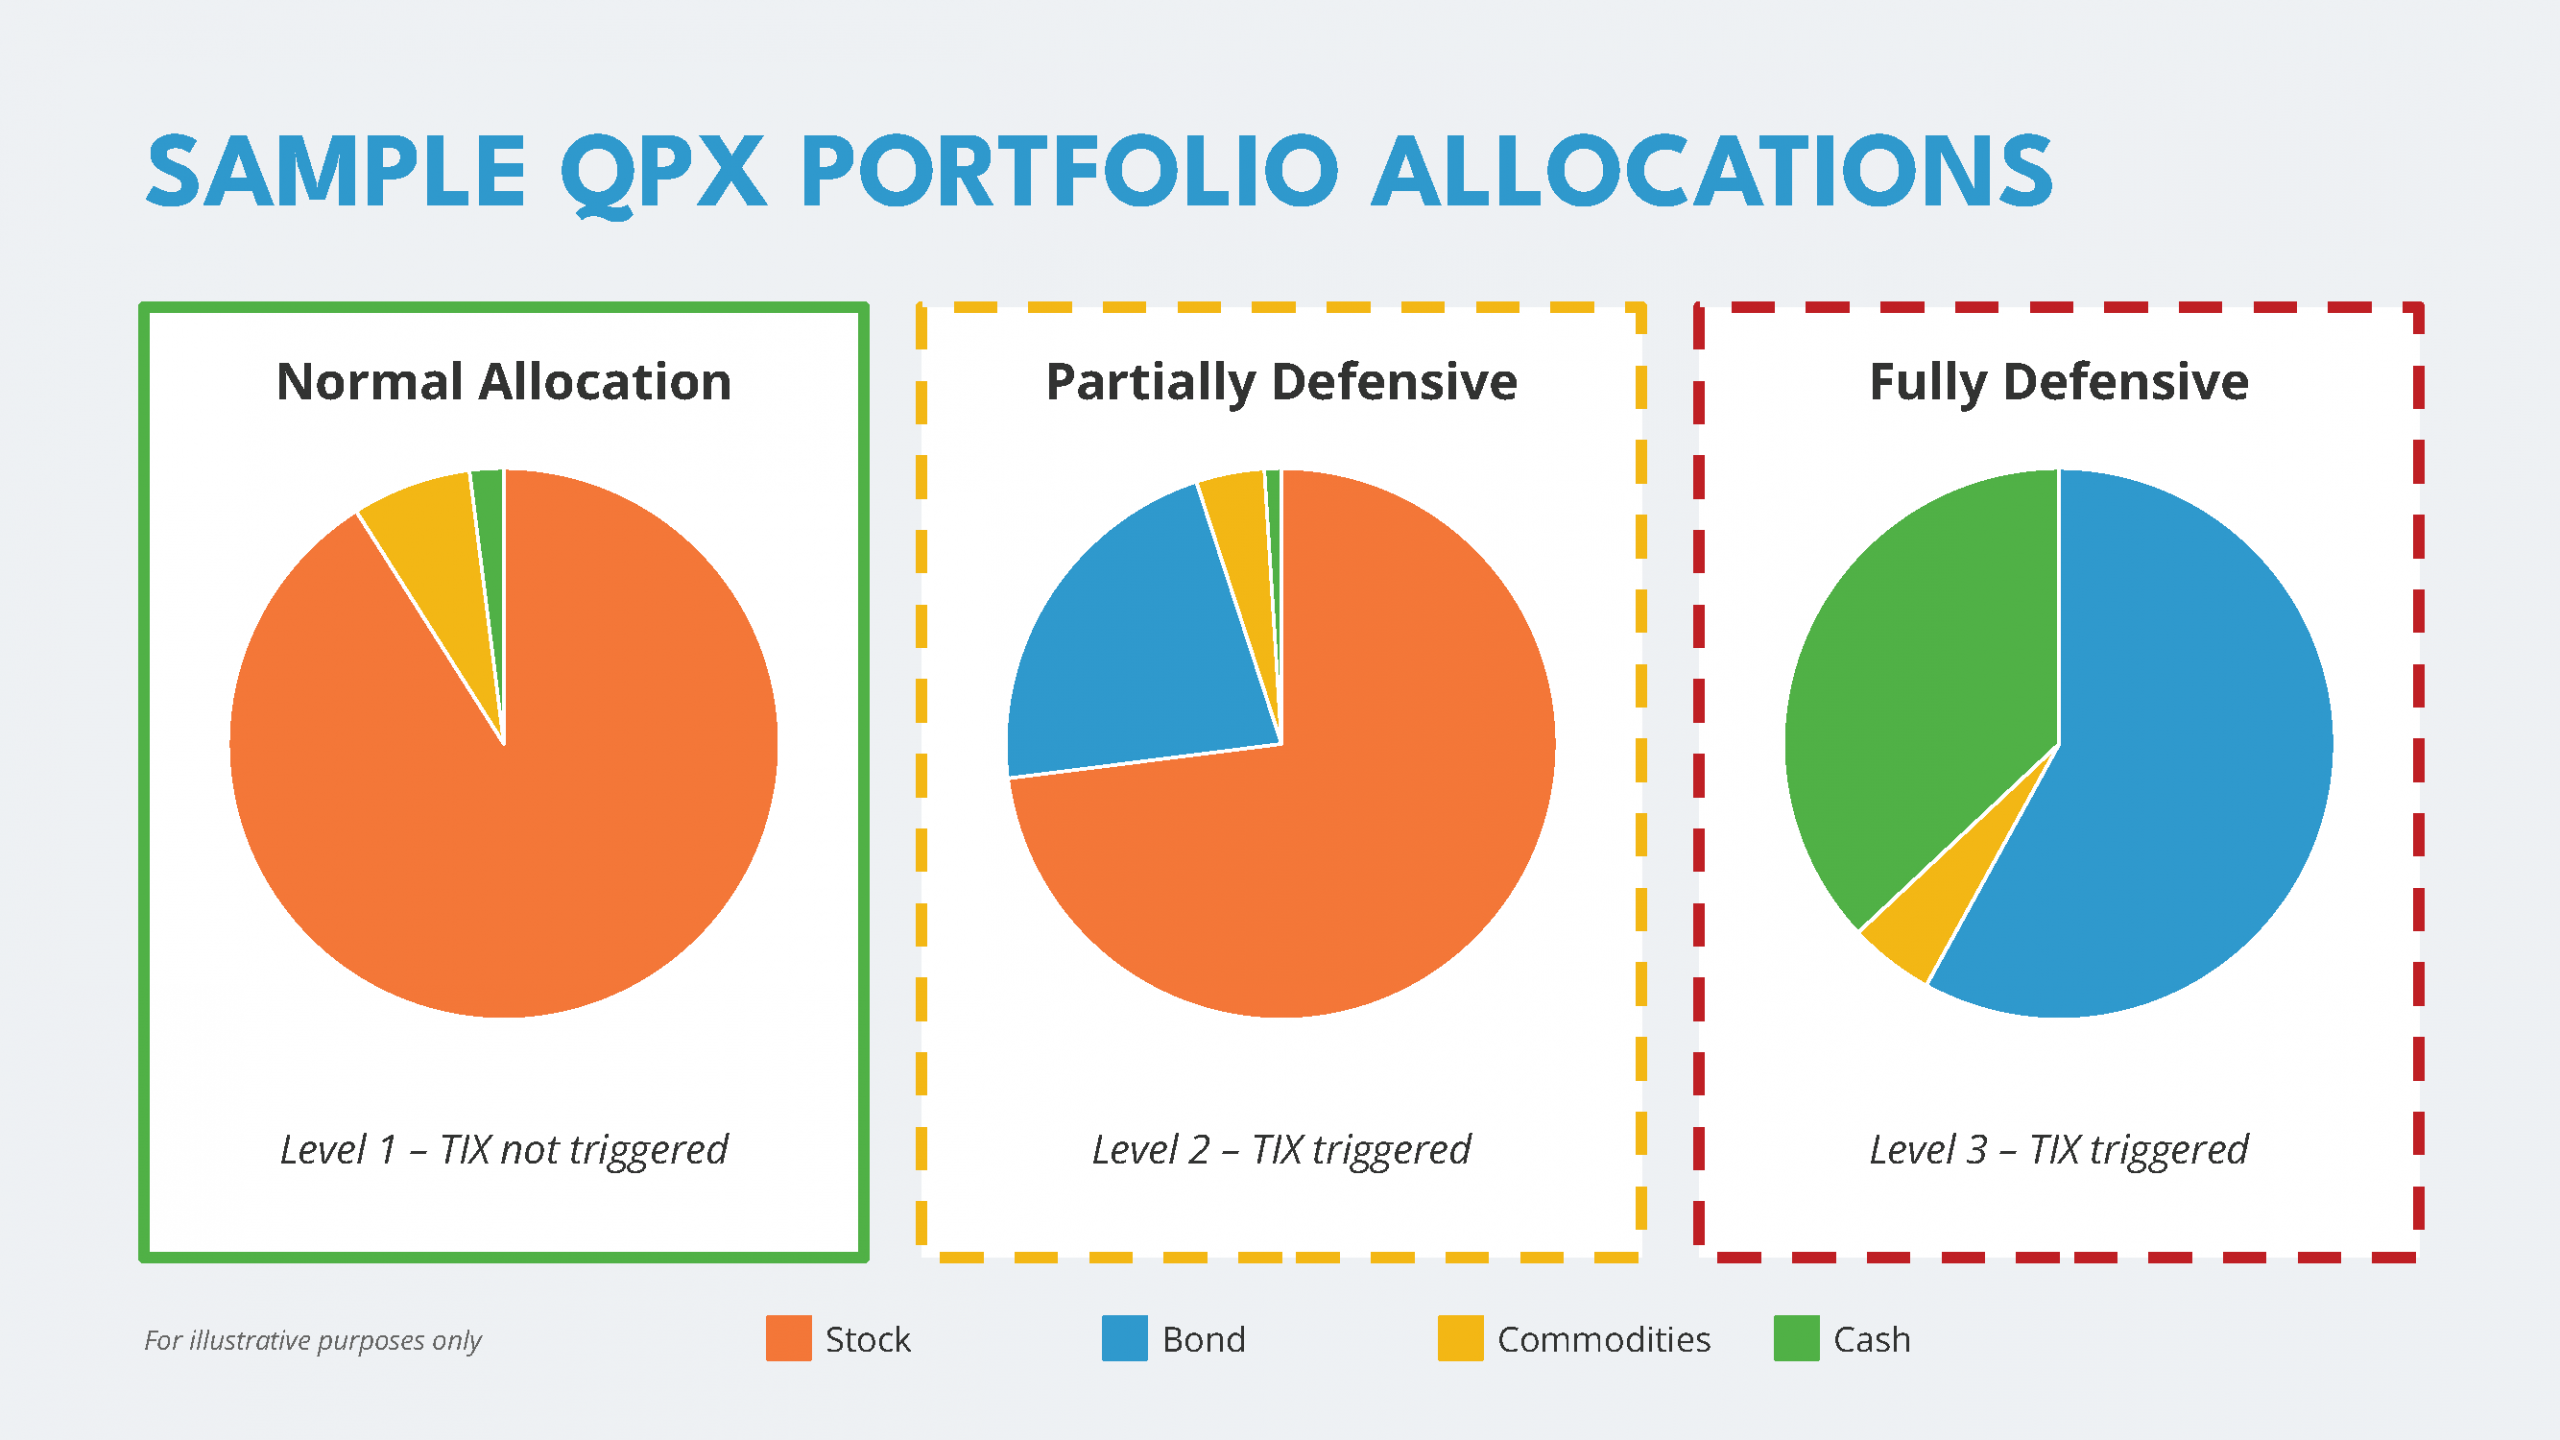
- Tactical Defense Overlay – QPX seeks to participate in equity market upside while seeking to limit downside exposure during periods of abnormal market volatility. When TIX is high, QPX will move to varying levels of defensive positioning, primarily short-term fixed income. Once TIX returns to normal levels, QPX will return to its equity-oriented, risk-optimized portfolio allocation.
Where Can QPX Fit in a Traditional Portfolio?
Key Attributes
- Quantitative Investment Process – QPX seeks to remove emotion from the investment process by using a disciplined, repeatable quantitative process to manage the portfolio.
- Risk-Optimized Portfolio – QPX calibrates its portfolio to a level of tail risk and expected drawdown equivalent to the overall U.S. equity market and optimizes its portfolio using a quantitative model that seeks the highest expected return within that level of risk.
- Operational & Tax Efficiency – QPX’s ETF structure allows for diverse asset class and security exposure in a single trade, as well as potential operational and tax efficiencies.
- Defense Trigger – When TIX signals abnormally high implied volatility, QPX will tactically allocate to a defensive portfolio consisting primarily of short-term fixed income until market volatility returns to normal.
About the Portfolio Strategist
QPX Overview from Ron Piccinini
Get an introduction to the QPX ETF directly from the portfolio strategist, Ron Piccinini.
QPX Overview from Ron Piccinini
Get an introduction to the QPX ETF directly from the portfolio manager, Ron Piccinini.
Fund
Price History
Fund Data
11/2/2026| NAV | $46.01 |
| Change | $-0.10 |
| Shares Outstanding | 700,000 |
| Assets Under Management | $32,206,296.28 |
Market Data
11/2/2026| Closing Price | $45.95 |
| Close Change | $-0.10 |
| Volume | 1,064 |
Regulatory Data
10/30/2026| Premium Discount | $-0.04 |
| 30-Day Median bid-ask Spread | 0.147415 |

FUND
Characteristics
As of 9/30/2026
*/
About the Implied Volatility Index (TIX™)
TIX is a proprietary implied volatility-based tactical indicator, computed daily as a weighted average of the implied volatilities of certain large ETFs representing different market sectors across asset classes. Because it is based on implied volatility, a forward-looking measure, rather than past price movements, TIX is designed to systematically and unemotionally identify abnormal market volatility and to help manage drawdowns. When TIX indicates normal volatility, QPX holds its equity-oriented, risk-optimized portfolio; when TIX is high, QPX moves to varying levels of defensive positioning, primarily short-term fixed income, until a move back to the equity-oriented portfolio is signaled.
Source: Morningstar & AdvisorShares *A fulcrum fee is a type of management fee that can go up or down based on the performance of the ETF as compared to a similar benchmark index. For more information please read the full prospectus or read more about fulcrum fees below.
FUND
Performance
As of 9/30/2026
| NAV | Market Price Return | S&P 500 Index | |
|---|---|---|---|
| 1 Month | -0.97 | -1.05 | -0.35 |
| 3 Months | -1.17 | -1.21 | 2.30 |
| YTD | 8.54 | 8.36 | 12.75 |
| 1 Year | 12.42 | 12.27 | 15.74 |
| 3 Year | 20.79 | 20.77 | 22.89 |
| 5 Year | 11.52 | 11.50 | 13.79 |
| Since Inception (12/28/2020 Annualized) | 12.10 | 12.08 | 14.90 |
As of 9/30/2026
| NAV | Market Price Return | S&P 500 Index | |
|---|---|---|---|
| 1 Month | -0.97 | -1.05 | -0.35 |
| 3 Months | -1.17 | -1.21 | 2.30 |
| YTD | 8.54 | 8.36 | 12.75 |
| 1 Year | 12.42 | 12.27 | 15.74 |
| 3 Year | 20.79 | 20.77 | 22.89 |
| 5 Year | 11.52 | 11.50 | 13.79 |
| Since Inception (12/28/2020, Annualized) | 12.10 | 12.08 | 14.90 |
Get Social @AdvisorShares
Join the conversation on social media to hear more from the portfolio manager, get informed about upcoming events and webinars, and more!
| Date | Account Symbol | Stock Ticker | Security ID | Security Description | Shares | Share Price | Market Value | Portfolio Weight | Asset Group |
|---|---|---|---|---|---|---|---|---|---|
| 11/02/2026 | QPX | XLY | 81369Y407 | SS CONSUMER DISC SELECT SECT | 65,050 | 118.16 | 7,686,308.00 | 23.85% | MF |
| XLV | 81369Y209 | SS HEALTH CARE SELECT SECTOR | 36,900 | 184.60 | 6,811,740.00 | 21.14% | MF | ||
| XLK | 81369Y803 | SS TECHNOLOGY SELECT SECTOR | 34,980 | 174.22 | 6,094,215.60 | 18.91% | MF | ||
| IYW | 464287721 | iShares USTechnology ETF | 21,925 | 236.45 | 5,184,166.25 | 16.09% | MF | ||
| XLE | 81369Y506 | SS ENERGY SELECT SECTOR | 42,700 | 67.25 | 2,871,575.00 | 8.91% | MF | ||
| XLC | 81369Y852 | SS COMM SELECT SECTOR SPDR | 25,165 | 100.26 | 2,523,042.90 | 7.83% | MF | ||
| X9USDFIIN | FIDELITY INSTL MMKT GOVT 57 | 800,053.52 | 1.00 | 800,053.52 | 2.48% | MM | |||
| CASH | 257,309.81 | 100.00 | 257,309.81 | 0.80% | CA |


FUND
Documents
FUND
| Management Fee | 1.08% | |
| Other Expenses | 0.46% | |
| Acquired Fund Fees and Expenses* | 0.32% | |
| Gross Expense Ratio | 1.86% | |
| Fee Waiver/Expense Reimbursement* | -0.09% | |
| Net Expense Ratio | 1.77% |
| Expense Cap Limitation* | 1.45% |
*The base management fee is 1.00%, which may adjust up or down by up to 0.10% based on the Fund’s performance relative to the S&P 500 Index; therefore, the management fee can range from 0.90% to 1.10%. Total Annual Operating Expenses and Total Annual Operating Expenses After Waiver/Reimbursement in this fee table may not correlate to the expenseratio in the Fund’s financial highlights because the financial highlights include only the Fund’s direct operating expenses and do not include AcquiredFund Fees and Expenses, which represent the Fund’s pro rata share of the fees and expenses of exchange-traded funds and/or money market funds in whichit invests.The Advisor has contractually agreed to keep net expenses from exceeding 1.45% of the Fund’s average daily net assets for at least one year from the date of the prospectus. The prospectus shows that the Advisor recaptured 0.04% during the most recent fiscal year, which is an expense of the Fund. For more information, please read the full prospectus.
Last Ten
Fund Distributions
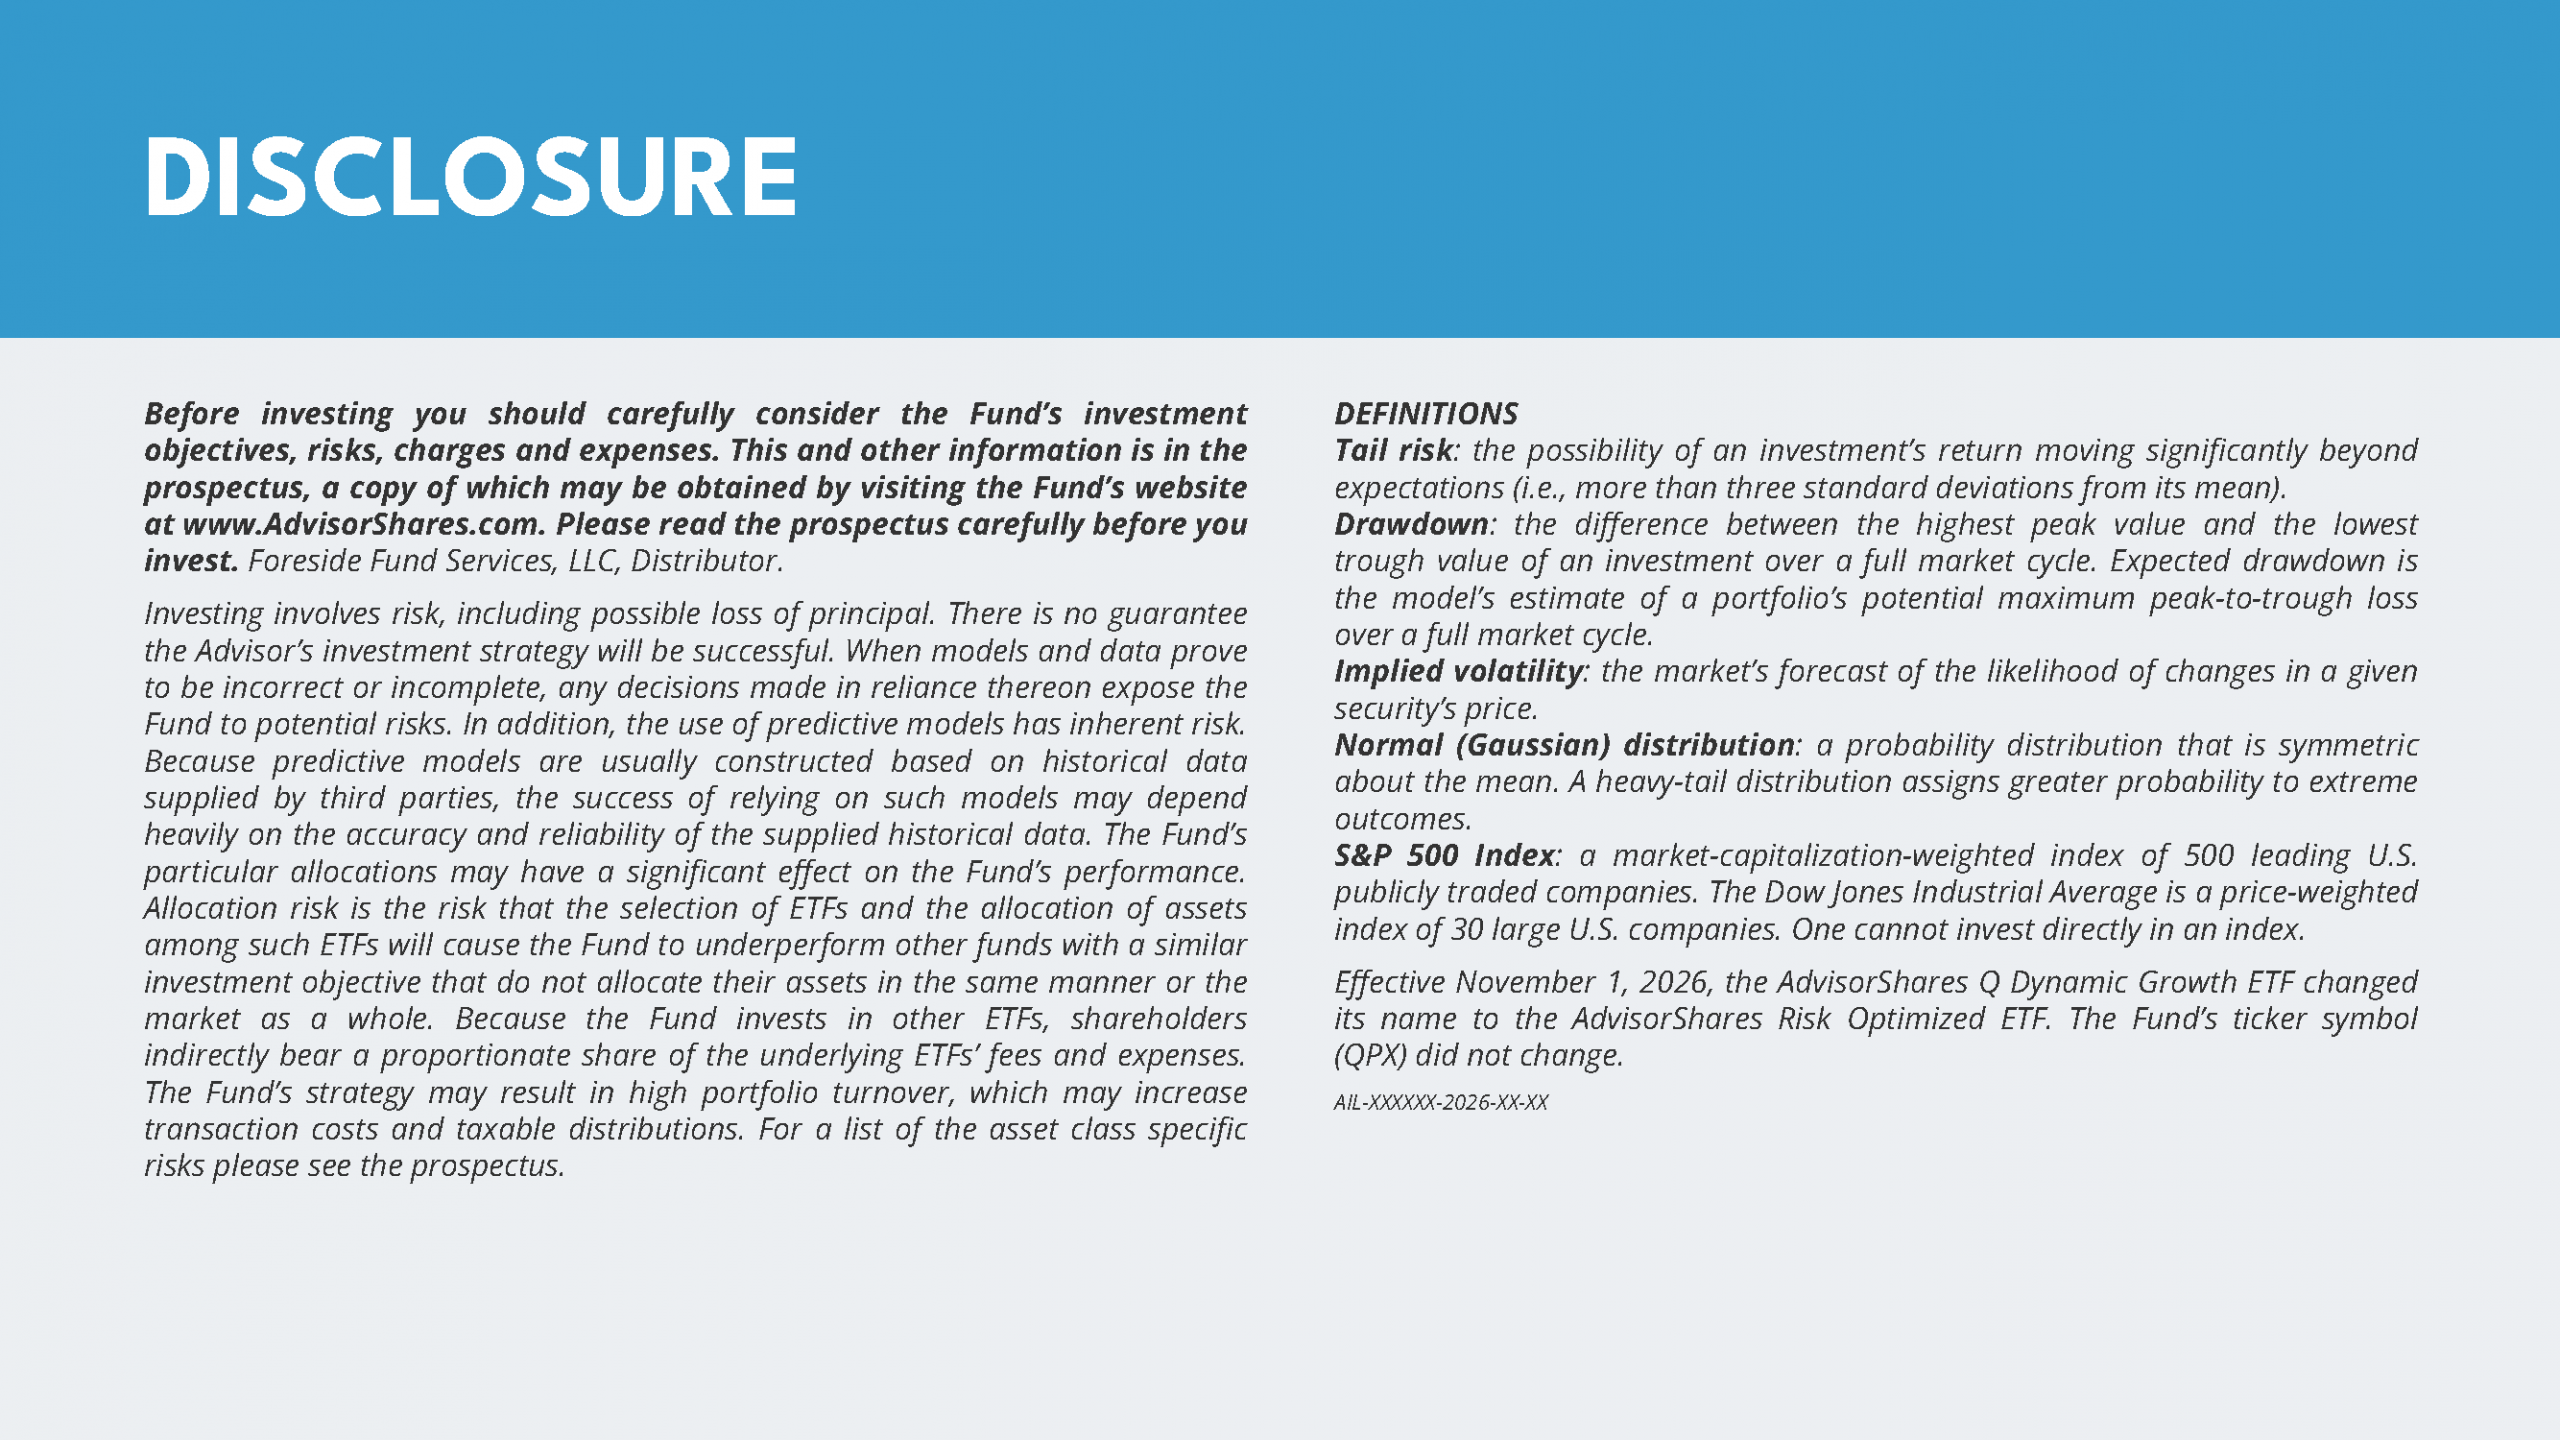
- Before investing you should carefully consider the Fund’s investment objectives, risks, charges and expenses. This and other information is in the prospectus, a copy of which may be obtained by visiting the Fund’s website at www.AdvisorShares.com. Please read the prospectus carefully before you invest. Foreside Fund Services, LLC, Distributor.
- Investing Involves Risk Including possible loss of principal
- Effective November 1, 2026, the AdvisorShares Q Dynamic Growth ETF changed its name to the AdvisorShares Risk Optimized ETF. The Fund’s ticker symbol (QPX) did not change.
- There is no guarantee the Advisors investment strategy will be successful. When models and data prove to be incorrect or incomplete, any decisions made in reliance thereon expose the Fund to potential risks. In addition, the use of predictive models has inherent risk. Because predictive models are usually constructed based on historical data supplied by third parties, the success of relying on such models may depend heavily on the accuracy and reliability of the supplied historical data. The Fund’s particular allocations may have a significant effect on the Fund’s performance. Allocation risk is the risk that the selection of ETFs and the allocation of assets among such ETFs will cause the Fund to underperform other funds with a similar investment objective that do not allocate their assets in the same manner or the market as a whole. For a list of the asset class specific risks please see the prospectus.
- Definitions
- Tail risk is the possibility of an investment’s return moving significantly beyond expectations (i.e., more than three standard deviations from its mean).
- Expected drawdown is the difference between the highest peak value and the lowest trough value of an investment over a full market cycle. Expected drawdown is the model’s estimate of a portfolio’s potential maximum peak-to-trough loss over a full market cycle.
The Morningstar Rating™ for funds, or “star rating,” is calculated for managed products (including mutual funds, variable annuity and variable life subaccounts, exchange-traded funds, closed-end funds, and separate accounts) with at least a three-year history. Exchange-traded funds and open-ended mutual funds are considered a single population for comparative purposes. It is calculated based on a Morningstar Risk-Adjusted Return measure that accounts for variation in a managed product’s monthly excess performance, placing more emphasis on downward variations and rewarding consistent performance. The top 10% of products in each product category receive 5 stars, the next 22.5% receive 4 stars, the next 35% receive 3 stars, the next 22.5% receive 2 stars, and the bottom 10% receive 1 star. The Overall Morningstar Rating for a managed product is derived from a weighted average of the performance figures associated with its three-, five-, and 10-year (if applicable) Morningstar Rating metrics. The weights are: 100% three-year rating for 36-59 months of total returns, 60% five-year rating/40% three-year rating for 60-119 months of total returns, and 50% 10-year rating/30% five-year rating/20% three-year rating for 120 or more months of total returns. While the 10-year overall star rating formula seems to give the most weight to the 10-year period, the most recent three-year period actually has the greatest impact because it is included in all three rating periods. Past performance is no guarantee of future results.
©2026 Morningstar, Inc. All Rights Reserved. Morningstar and/or its content providers are the proprietors of this information; do not permit its unauthorized copying or distribution; do not warrant it to be accurate, complete or timely; and are not responsible for damages or losses arising from its use. Past performance is no guarantee of future results.
QPX received five stars for the overall rating among 229 funds, five stars for the 3-year rating among 229, and five stars for the 5-year rating among 202 funds in Morningstar’s Tactical Allocation category as of September 30th, 2026.
ETF Social Conversation