
$0.16
| Symbol | Exchange | Inception Date | CUSIP | NAV | Options Available |
|---|---|---|---|---|---|
| VEGA | NYSE Arca | 9/17/2012 | 00768Y768 | VEGA.NV | Yes |
About the ETF
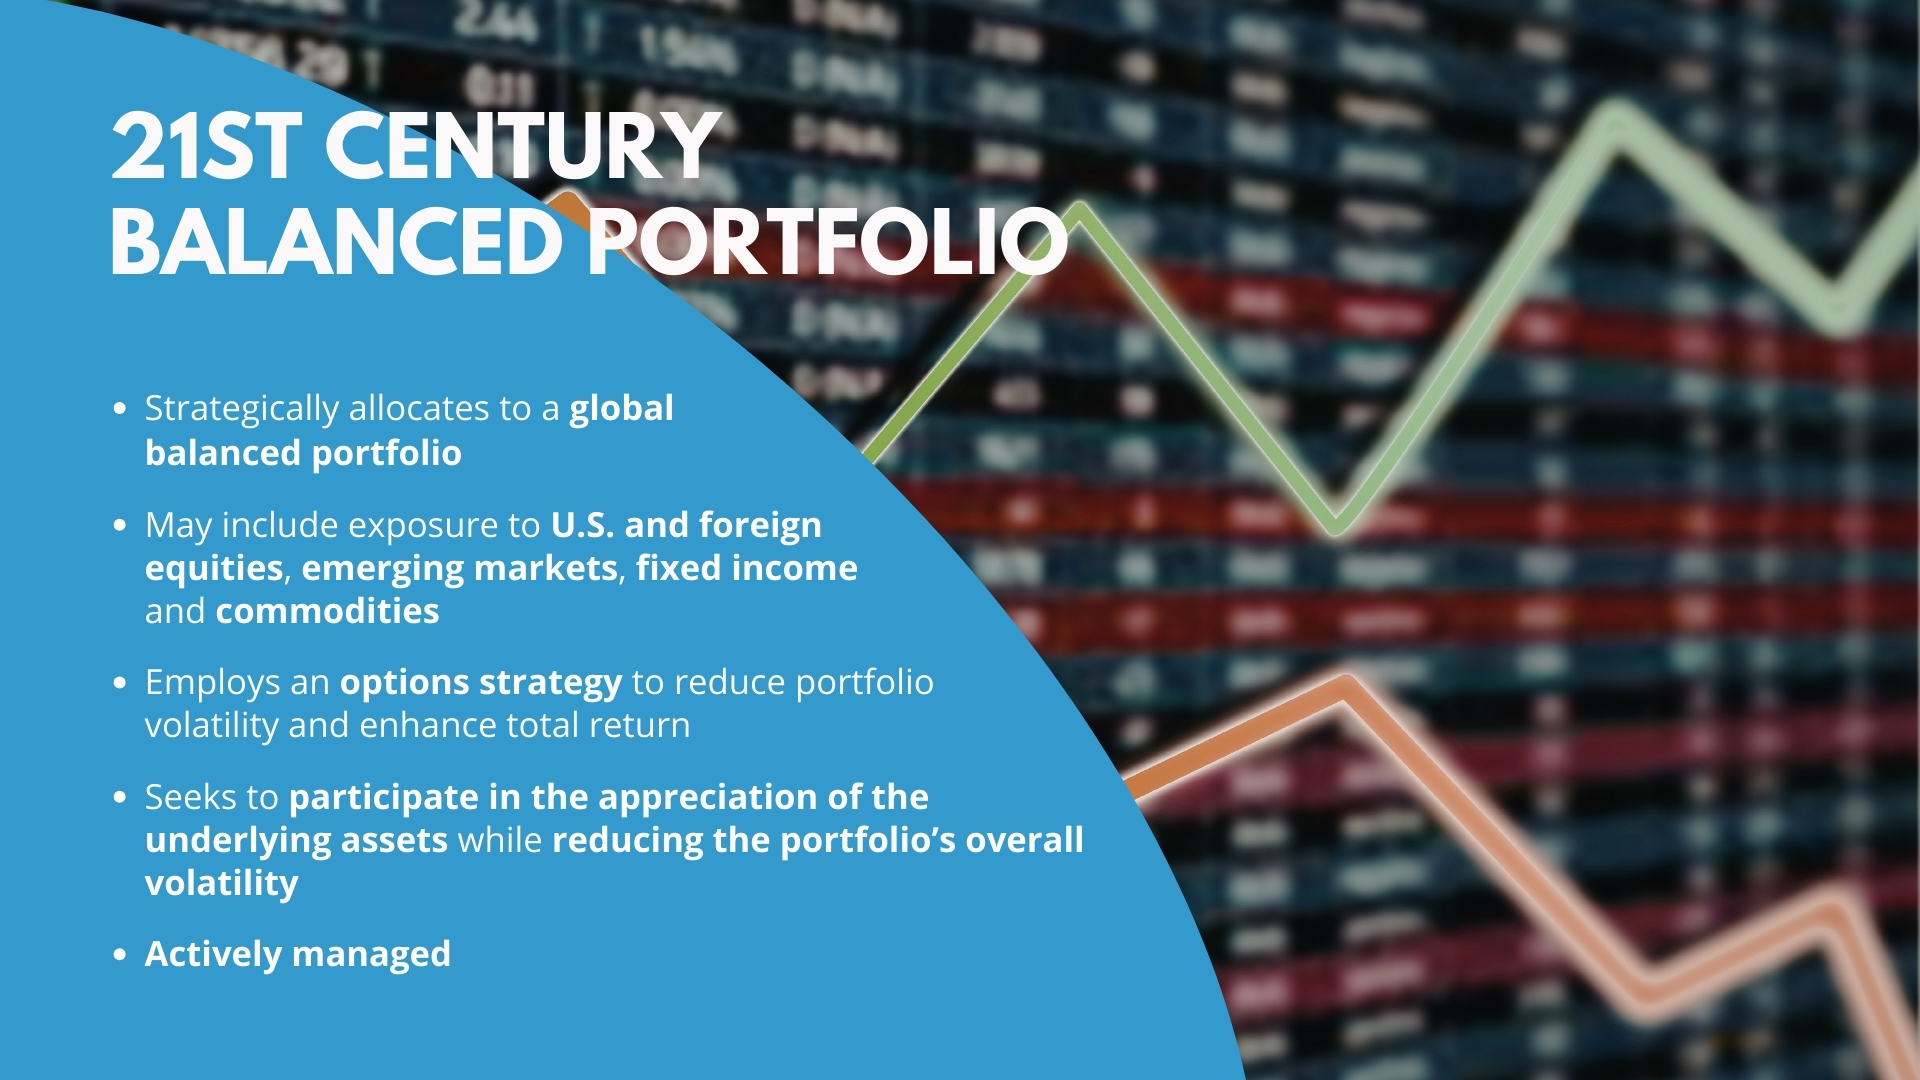
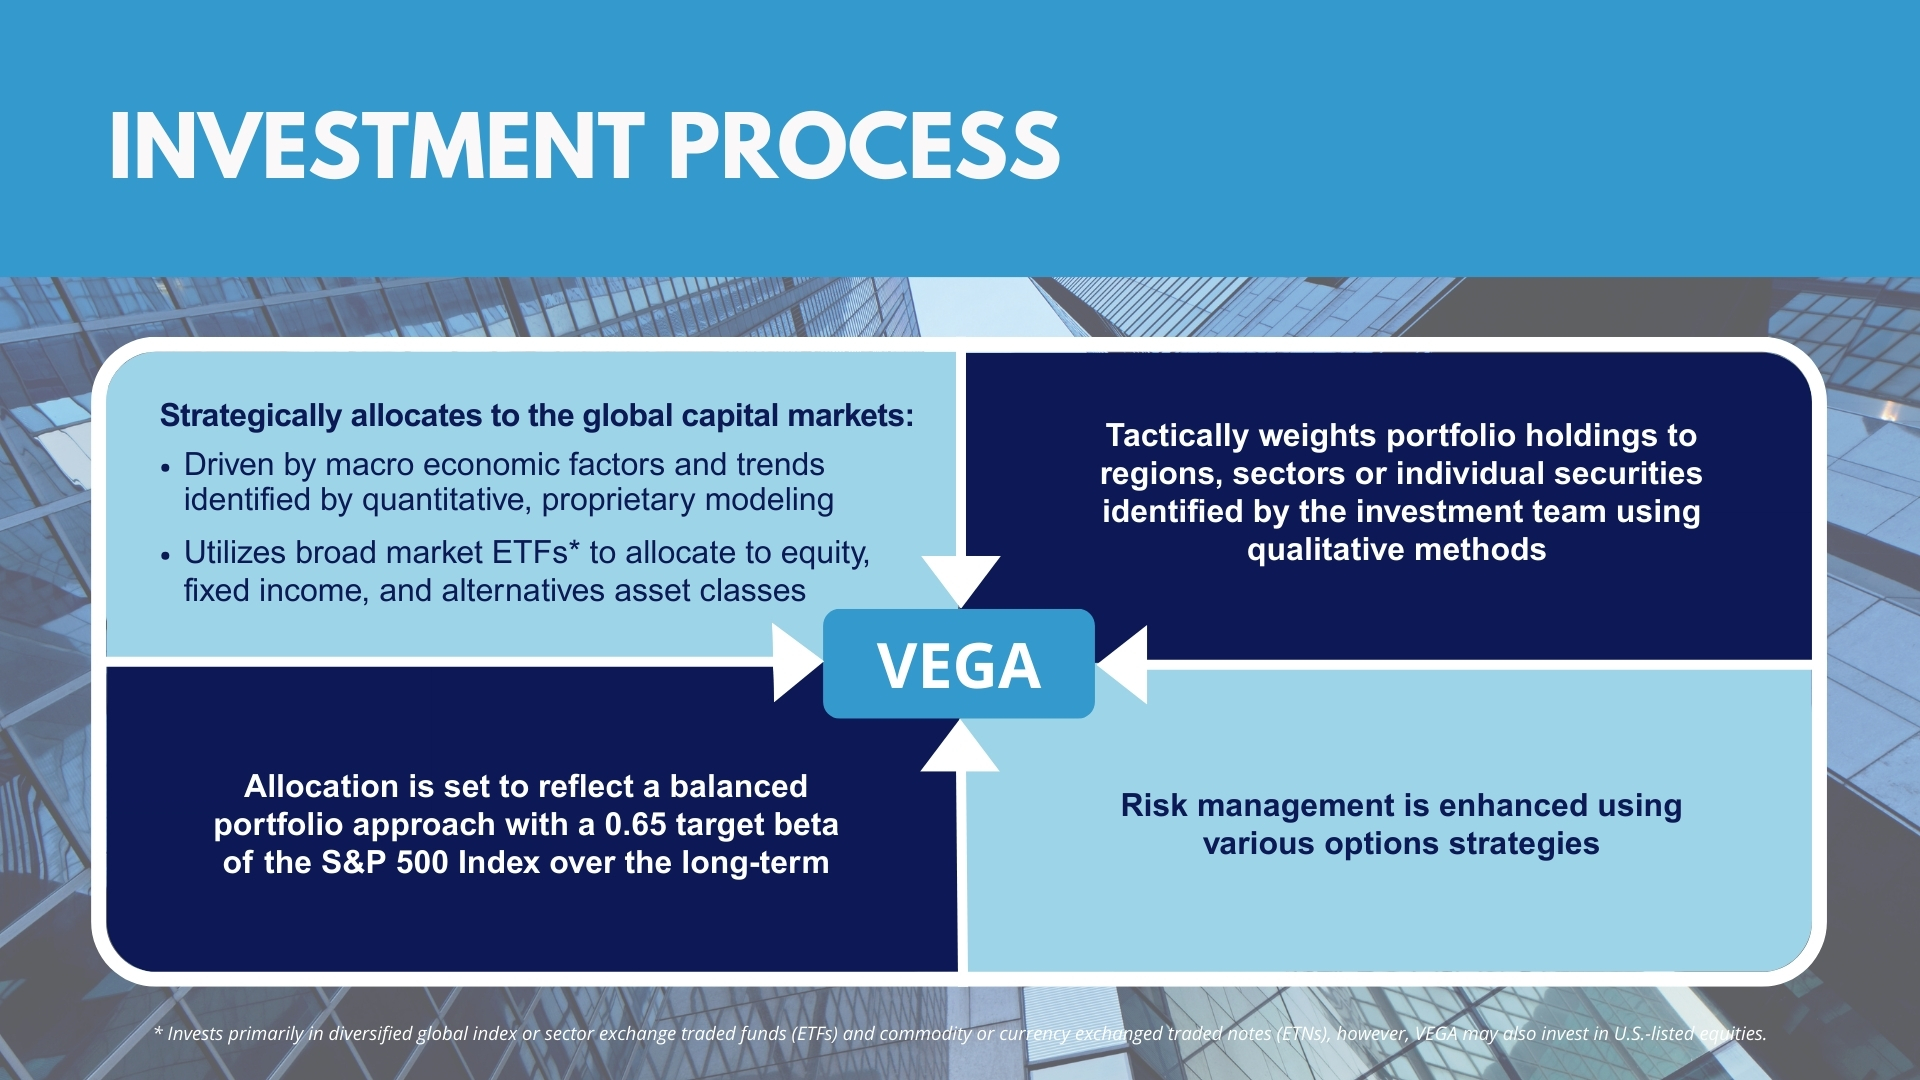
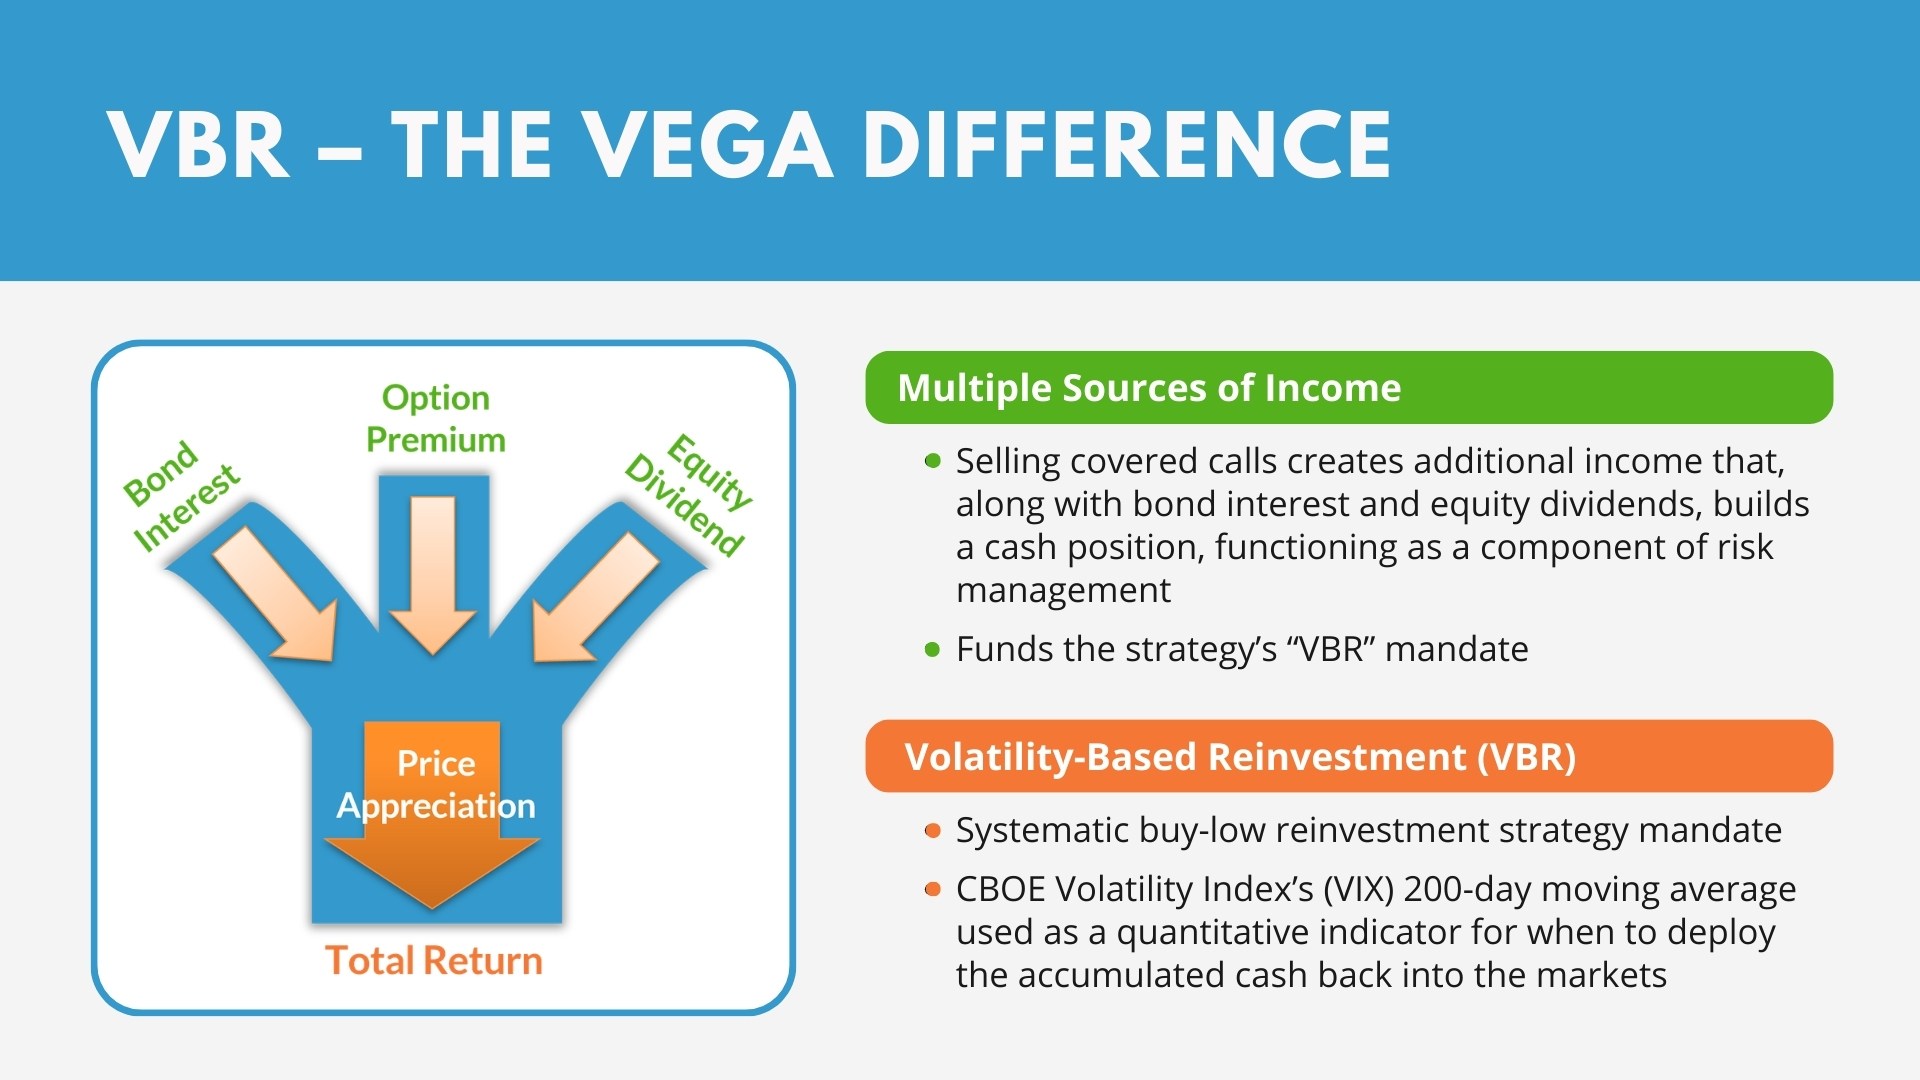
The AdvisorShares STAR Global Buy-Write ETF (NYSE Arca: VEGA) is a low volatility, moderate risk, global balanced portfolio that strategically allocates to the capital markets and tactically overweights regions, sectors, or securities. VEGA also employs option strategies to create additional sources of income for total return and risk management. The Portfolio Manager writes (sells) covered call options against a portion of its underlying equity holdings. This extra source of income from the cover calls, along with the bond interest and equity dividends collected on the portfolio, can assist in hedging downside risk. This collective income stream also serves as the “funding source” for an internal systematic reinvestment strategy called Volatility Based Reinvestment (VBR). When equity volatility is high, as gauged by the VIX’s 200-day moving average, VEGA reinvests its cash positions back into the capital markets. When volatility is low, the Portfolio Manager may allocate a portion of VEGA’s cash position to protective put options for downside risk management. Over the long term, VEGA’s risk objective is a 0.65 beta of the S&P 500 Index.
Why Invest in VEGA?
- A Lower Volatility, Risk Managed Solution – VEGA’s global balanced approach achieves its low volatile mandate by 1) developing a strategic asset allocation to the equity and fixed income markets; 2) tactically overweighting the portfolio to regions, sectors, or securities; and 3) employing multiple option strategies to enhance income streams and manage downside risk.
- Total Return Solution – Performance for VEGA is driven by collecting multiple sources of income from bond interest, equity dividends, and option premium, as well as from potential capital appreciation of its portfolio allocations. Additionally, VEGA’s option strategies for managing risk during market drawdowns are intended to contribute to its total return.
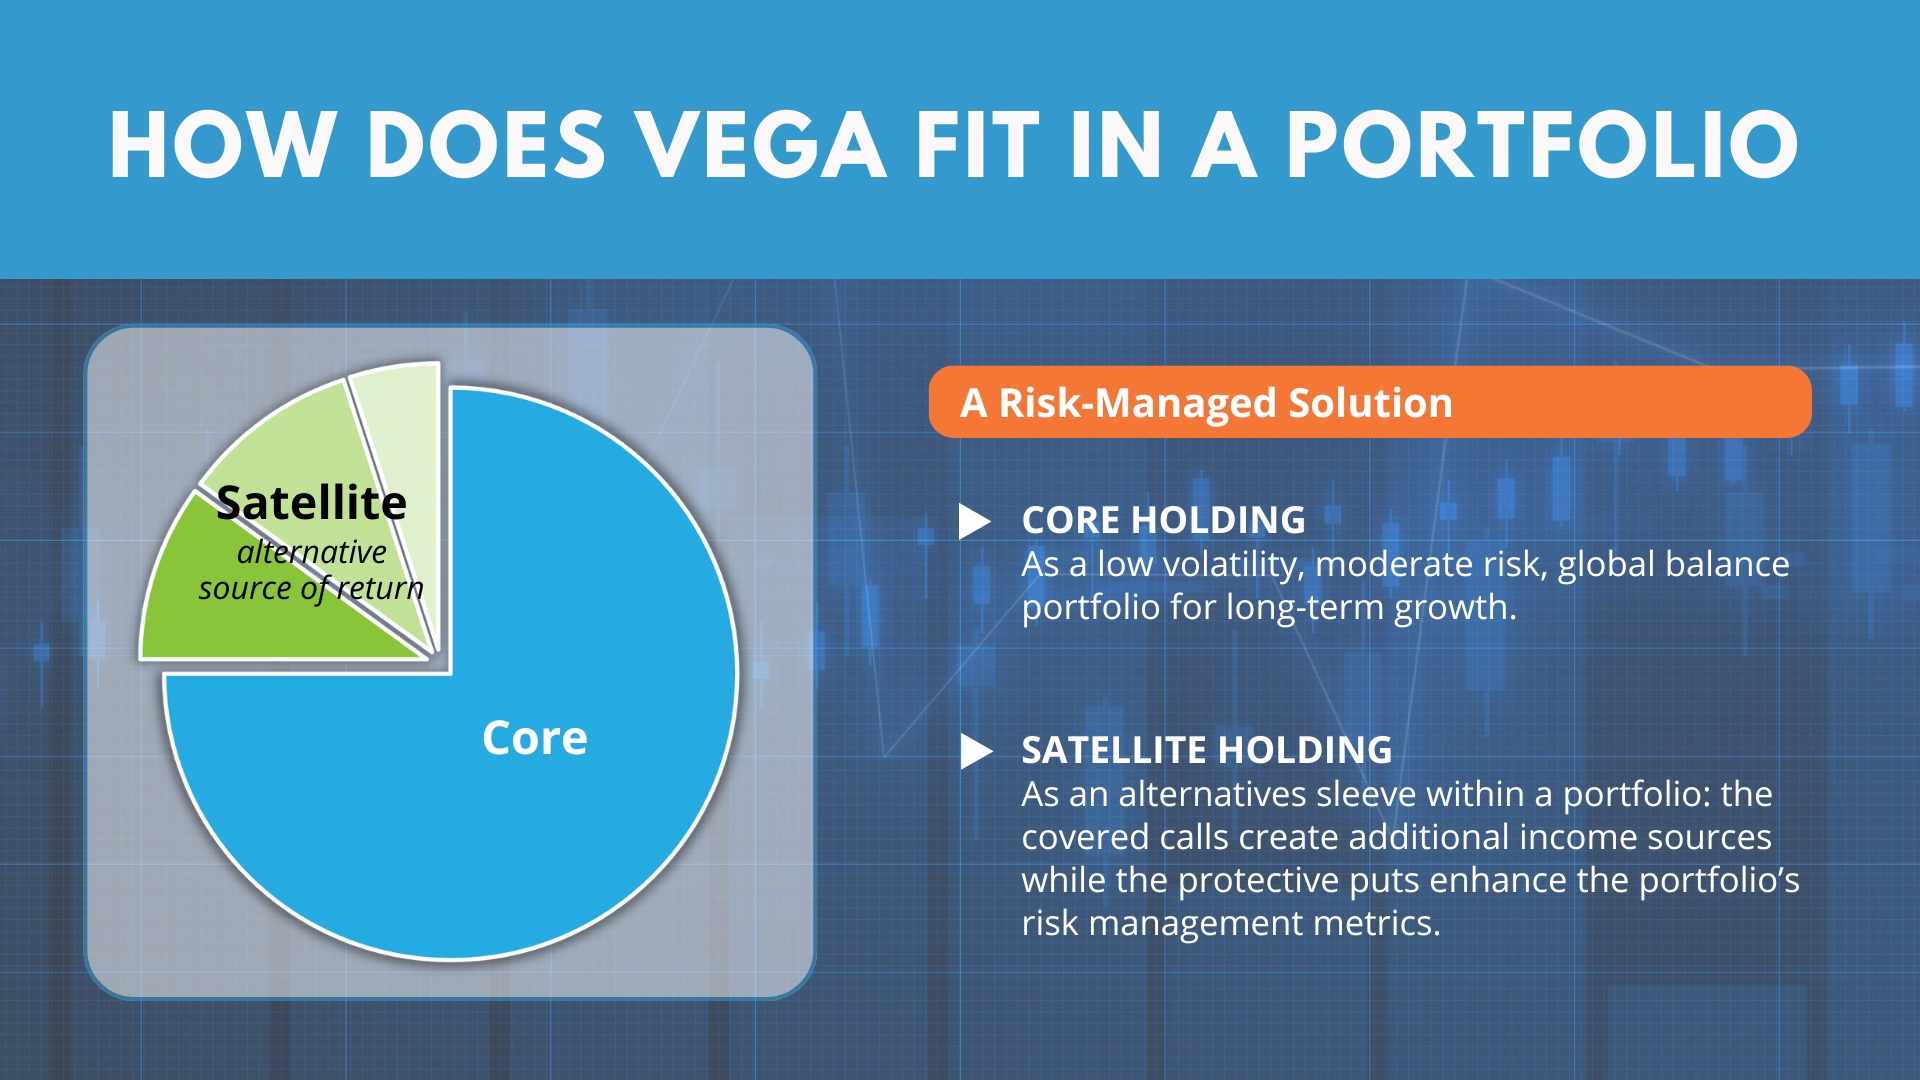
- Alternatives Solution – Highlighting the varying option strategies, VEGA can be part of an alternative sleeve within a portfolio. Selling covered calls creates an additional source of portfolio income and buying protective puts may enhance the portfolio’s risk metrics.
Where Can VEGA Fit in a Traditional Portfolio?
VEGA can serve as a core holding or as an alternatives sleeve within a portfolio.
Key Attributes
- Asset Allocation – The strategy’s global balanced approach tactically allocates to bonds, equities, and alternatives through broad market ETFs and strategically overweights regions, sectors, or individual securities. Asset allocation is the first step in managing the portfolio’s overall risk objective to a 0.65 beta of the S&P 500 Index.
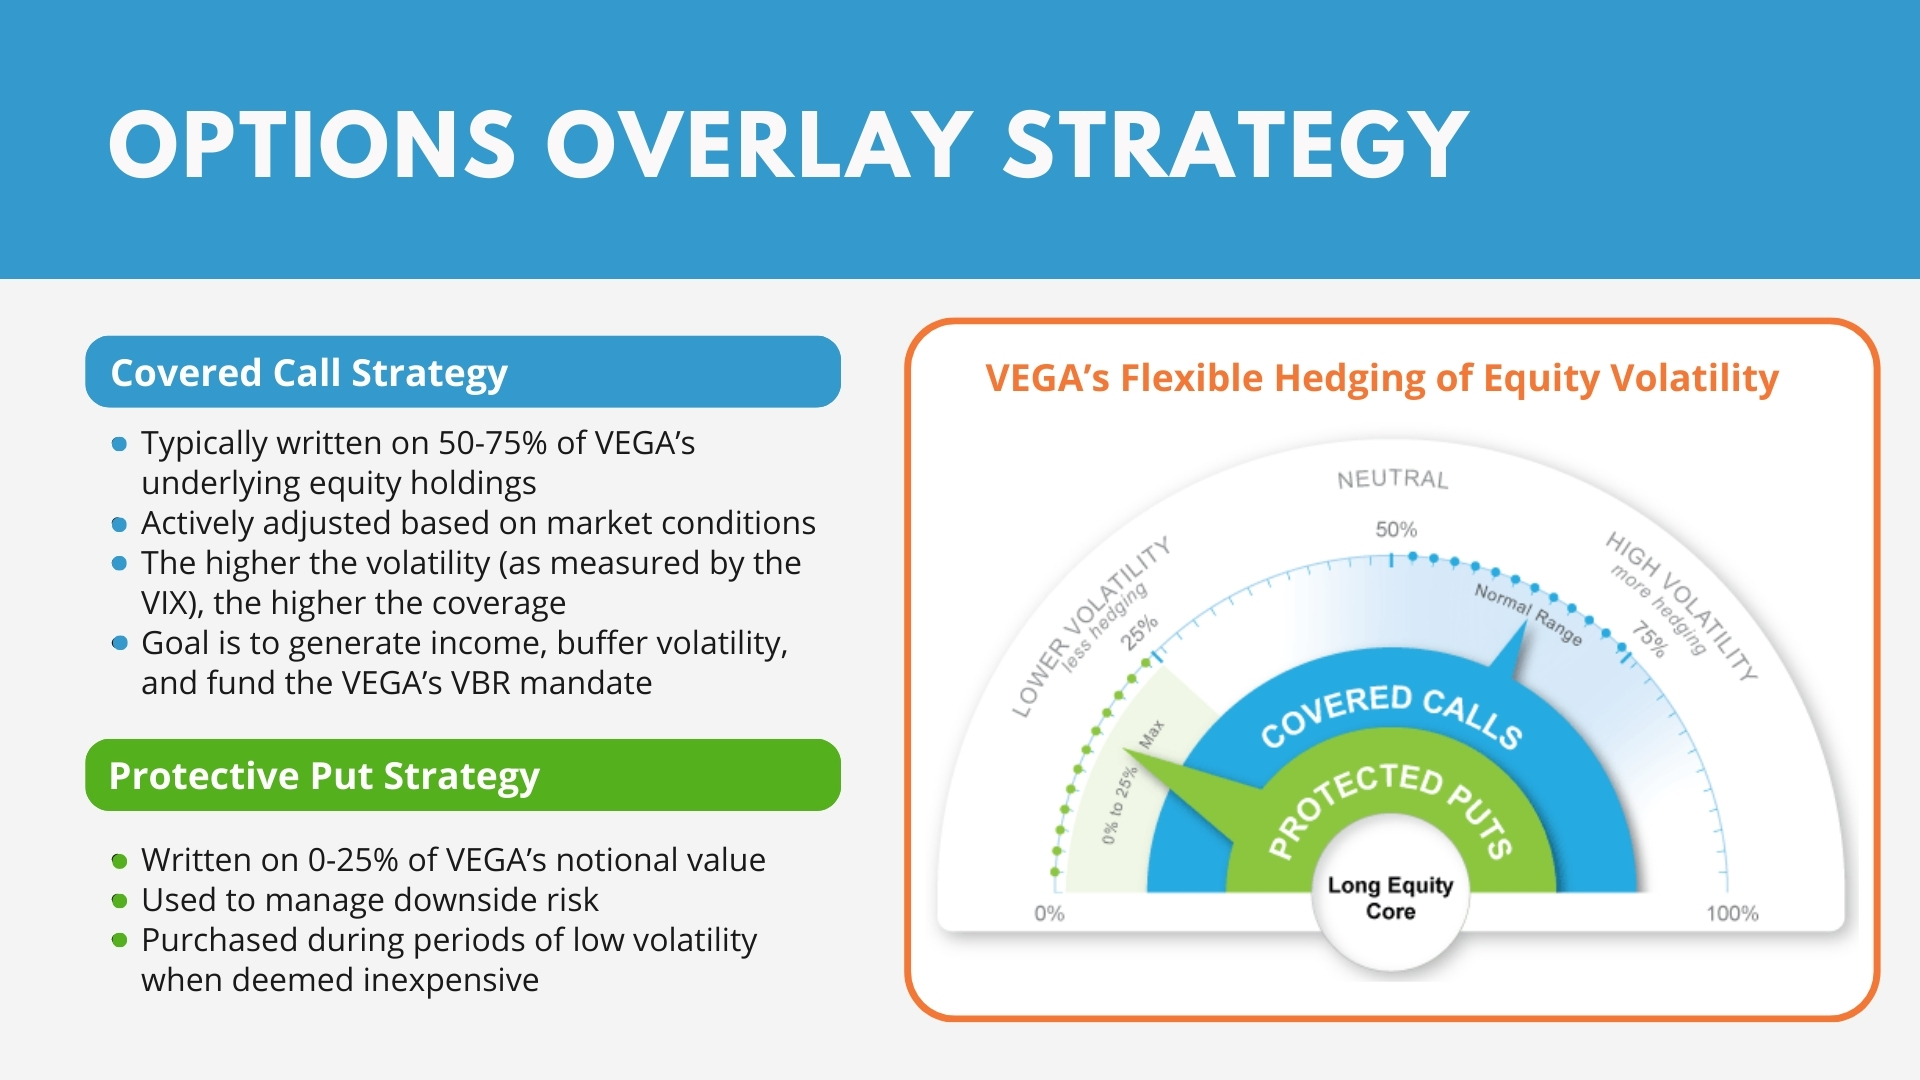
- Option Strategies for Income – The Portfolio Manager actively manages a covered call strategy on the portfolio’s equity holdings to add an additional income source to the bond interest and equity dividends. The cash collected from the combined income sources accumulates and serves as a second component to VEGA’s overall risk management objective of 0.65 beta to the S&P 500 Index. This income “self -funds” VEGA’s internal Volatility Based Reinvestment (VBR) strategy: a systematic buy-low reinvestment strategy triggered by market volatility, as measured by the VIX.
- Option Strategies for Protection – Using the cash position that accumulates from the collection of bond interest, equity dividends, and option premium, the Portfolio Manager may purchase “protective puts” on up to 25% of VEGA’s notional value. This is a third step towards managing the portfolio’s overall risk objective to a 0.65 beta of the S&P 500 Index.
- Harnessing Volatility – Movements in price, whether in an upward or downward manner, can be captured through the use of option contracts and be additive to total return. When volatility is high, option premiums rise and writing contracts (sell) can add to the portfolio’s income stream by collecting premium. When volatility is low, purchasing long term protective puts can be a risk management tool designed to reduce the portfolio’s downside participation.
- Total Return Solution – Performance for VEGA will be driven by collecting multiple sources of income from bond interest, equity dividends, and option premium and from capital appreciation of its portfolio holdings. Additionally, VEGA’s option strategies for managing risk during market drawdowns are intended to contribute to its total return over a market cycle.
About the Portfolio Manager
Kenneth R. Hyman, Portfolio Manager
Mr. Hyman serves as an Executive Vice President and portfolio manager for the Sub-Advisor, CreativeOne Wealth. Mr. Hyman joined the Sub-Advisor in October 2020 after the Sub-Advisor acquired substantially all the assets of Partnervest Financial Group LLC and its subsidiaries, including Partnervest Advisory Services, LLC, the former sub-advisor to VEGA. Mr. Hyman founded Partnervest Financial Group, LLC in 2001 and was responsible for the direction and oversight of its business affairs and served as a portfolio manager and member of the Investment Management Committee. Mr. Hyman also provided consulting services to Elysian Capital Holdings LLC, an equity owner of Partnervest and served as the Chief Compliance Officer of Elysian’s subsidiaries. Prior to establishing Partnervest Financial Group, LLC, Mr. Hyman was the Senior Executive and Financial Officer for Integral Securities, Inc. and Integral Securities Europe Ltd., the Managing Principal and Chief Operating Officer of Mercer Global Securities and the Director of Operations for Mercer Global Advisors, and the Vice President of trading for Associated Financial Group.
Matthew A. Heimann, CFA®, Portfolio Manager
Mr. Heimann joined CreativeOne Wealth in 2023 and currently serves as its Chief Investment Officer, Chairman of the Investment Committee, and Portfolio Manager. Prior to CreativeOne, Mr. Heimann served as the Chief Investment Officer at Logia Portfolio Management, where he developed and oversaw the investment philosophy for $1.5 billion in peak assets. He earned his bachelor’s degree in finance from the University of Missouri and an MBA from the University of Missouri-Kansas City.

Fund
Price History
Fund Data
6/12/2026| NAV | $52.08 |
| Change | $0.16 |
| Shares Outstanding | 1,690,000 |
| Assets Under Management | $88,015,280.70 |
Market Data
6/11/2026| Closing Price | $51.90 |
| Close Change | $0.80 |
| Volume | 6,049 |
Regulatory Data
6/11/2026| Premium Discount | $0.01 |
| 30-Day Median bid-ask Spread | 0.077340 |
Shares are bought and sold at market price (closing price) not NAV and are not individually redeemed from the Fund. Market price returns are based on the midpoint of the bid/ask spread at 4:00 pm Eastern Time (when NAV is normally determined), and do not represent the return you would receive if you traded at other times.
")
FUND
Characteristics
As of 5/31/2026
*Source: Morningstar & AdvisorShares. Performance data quoted represents past performance and is no guarantee of future results. The S&P 500 Index is a broad-based, unmanaged measurement of changes in stock market conditions based on the average of 500 widely held common stocks. One cannot invest directly in an index.
FUND
Performance
As of 5/31/2026
| NAV | Market Price Return | MSCI World Index | MSCI ACWI Index | |
|---|---|---|---|---|
| 1 Month | 2.97 | 3.15 | 4.55 | 5.16 |
| 3 Months | 4.07 | 4.23 | 7.28 | 7.54 |
| YTD | 7.09 | 7.37 | 10.49 | 12.15 |
| 1 Year | 19.73 | 19.95 | 27.49 | 30.27 |
| 3 Years | 14.61 | 14.66 | 21.89 | 22.30 |
| 5 Years | 7.33 | 7.43 | 11.96 | 11.45 |
| 10 Years | 7.99 | 8.02 | 13.09 | 12.81 |
| Since Inception (9/17/2012, Annualized) | 6.26 | 6.27 | 11.79 | 11.19 |
As of 3/31/2026
| NAV | Market Price Return | MSCI World Index | MSCI ACWI Index | |
|---|---|---|---|---|
| 1 Month | -4.56 | -4.53 | -6.37 | -7.18 |
| 3 Months | -1.79 | -1.65 | -3.57 | -3.20 |
| YTD | -1.79 | -1.65 | -3.57 | -3.20 |
| 1 Year | 13.73 | 13.81 | 18.90 | 20.01 |
| 3 Years | 11.42 | 11.67 | 16.77 | 16.58 |
| 5 Years | 6.17 | 6.19 | 10.27 | 9.49 |
| 10 Years | 7.16 | 7.16 | 11.80 | 11.33 |
| Since Inception (9/17/2012, Annualized) | 5.66 | 5.66 | 10.82 | 10.13 |
Get Social @AdvisorShares
Join the conversation on social media to hear more from the portfolio manager, get informed about upcoming events and webinars, and more!
| Date | Account Symbol | Stock Ticker | Security ID | Security Description | Shares | Share Price | Market Value | Portfolio Weight | Asset Group |
|---|---|---|---|---|---|---|---|---|---|
| 06/12/2026 | VEGA | SPY | 78462F103 | SS SPDR S&P 500 ETF TRUST-US | 48,308 | 741.75 | 35,832,459.00 | 40.71% | MF |
| IUSB | 46434V613 | ISHR CR UNVRSE USD BD ETF-UI | 327,309 | 46.05 | 15,072,579.45 | 17.13% | MF | ||
| EFA | 464287465 | ISHARES MSCI EAFE ETF | 91,031 | 105.02 | 9,560,075.62 | 10.86% | MF | ||
| DYNF | 09290C103 | ISHRS US E F R A ETF-USD INC | 96,624 | 66.64 | 6,439,023.36 | 7.32% | MF | ||
| GOVT | 46429B267 | ISHARES US TREASURY BOND ETF | 239,369 | 22.71 | 5,436,069.99 | 6.18% | MF | ||
| EEM | 464287234 | ISHARES MSCI EMERGING MARKET | 70,822 | 67.88 | 4,807,397.36 | 5.46% | MF | ||
| IWP | 464287481 | ISHARES RUSSELL MID-CAP GROW | 25,082 | 140.80 | 3,531,545.60 | 4.01% | MF | ||
| MBB | 464288588 | ISHARES MBS ETF | 35,510 | 94.38 | 3,351,433.80 | 3.81% | MF | ||
| IAU | 464285204 | ISHARES GOLD TRUST | 18,159 | 79.19 | 1,438,011.21 | 1.63% | MF | ||
| 020Z8HFD5 | SPY US 07/17/26 P590 | 305 | 0.54 | 16,470.00 | 0.02% | O | |||
| 02280WNZ0 | SPY US 06/18/26 C752 | -305 | 1.70 | -51,850.00 | -0.06% | O | |||
| X9USDBLKR | BLACKROCK LIQUIDITY T 60 | 2,741,960.24 | 1.00 | 2,741,960.24 | 3.12% | MM | |||
| CASH | -162,055.87 | 100.00 | -162,055.87 | -0.18% | CA |
FUND
Documents
FUND
Fees & Expenses
Annual Fund Operating Expenses (expenses that you pay each year as a percentage of the value of your investment)
| Management Fee | 0.85% | |
| Other Expenses | 0.26% | |
| Acquired Fund Fees and Expenses* | 0.14% | |
| Net Expense Ratio | 1.25% |
| Expense Cap Limitation* | 1.85% |
*Total Annual Operating Expenses in this fee table may not correlate to the expense ratios in the Fund’s financial highlights because the financial highlights include only the Fund’s direct operating expenses and do not include Acquired Fund Fees and Expenses, which represent the Fund’s pro rata share of the fees and expenses of any money market fund and/or affiliated ETF in which it invested. Acquired fund fees represent the indirect costs a fund bears when it invests in other funds like mutual funds or ETFs. Listed separately in a fund’s prospectus for clarity, especially in fund-of-funds structures, these fees aren’t paid directly by investors but are factored into the total expense ratio and can influence performance. The Advisor has contractually agreed to limit the Fund’s total annual operating expenses to 1.85% of average daily net assets. Because the Fund’s current net expense ratio is below the contractual cap, this limit is not presently in effect. For more information, please read the full prospectus.
Last Ten
Fund Distributions
")
-
-
- Before investing you should carefully consider the Fund’s investment objectives, risks, charges and expenses. This and other information is in the prospectus, a copy of which may be obtained by visiting the Fund’s website at www.AdvisorShares.com. Please read the prospectus carefully before you invest. Foreside Fund Services, LLC, Distributor.
- There is no guarantee that the Fund will achieve its investment objective. An investment in the Fund is subject to risk, including the possible loss of principal amount invested. Other Fund risks included: allocation risk; derivative risk; early closing risk; Exchange Traded Note risk; liquidity risk, market risk; trading risk; commodity risk; concentration risk; counterparty risk; credit risk; emerging markets and foreign securities risk; foreign currency risk; large-, mid- and small- cap stock risk. Please see the prospectus for detailed information regarding risk. The Fund is also subject to options risk. Writing and purchasing call and put options are specialized activities and entail greater than ordinary investment risk. The value of the Fund’s positions in options fluctuates in response to the changes in value of the underlying security. The Fund also risks losing all or part of the cash paid for purchasing call and put options. The Fund may not be suitable for all investors.
-
-
- Definitions
- Covered Call percentage is derived from taking the total amount of Covered Calls sold over the total amount of Covered Calls available to be sold on the current shares in the portfolio. Covered Calls must be sold on lots of 100 (referred to as a round lot), so any shares that do not fit into an even lot are excluded from the calculation. Protective Put percentage is the Notional Value of the Protective Puts over the current value of the total portfolio. Notional Value is calculated by taking the strike of the Protective Put multiplied the number of contracts held multiplied 100.
- A covered call option involves holding a long position in a particular asset, in this case shares of an ETP, and writing a call option on that same asset with the goal of realizing additional income from the option premium. A put option is a contract that gives the owner of the option the right to sell a specified amount of the asset underlying the option at a specified price within a specified time.
- Exercising an option means to put into effect the right specified in a contract.
- An option is a privilege, sold by one party to another that gives the buyer the right, but not the obligation, to buy (call) or sell (put) a stock at an agreed upon price within a certain period or on a specific date.
- An option premium is income received by an investor who sells or “writes” an option contract to another party.
- A protective put is an option strategy which entails buys shares of a security and, at the same time, enough put options to cover those shares. This can act as a hedge on the invested security, since matching puts with shares of the stock can limit the downside (due to the nature of puts).
-
-
ETF Social Conversation