
| Symbol | Exchange | Inception Date | CUSIP | NAV |
|---|---|---|---|---|
| AADR | Nasdaq | 7/20/2010 | 00768Y206 | AADR.NV |
Click on the above slides to expand the slide view.
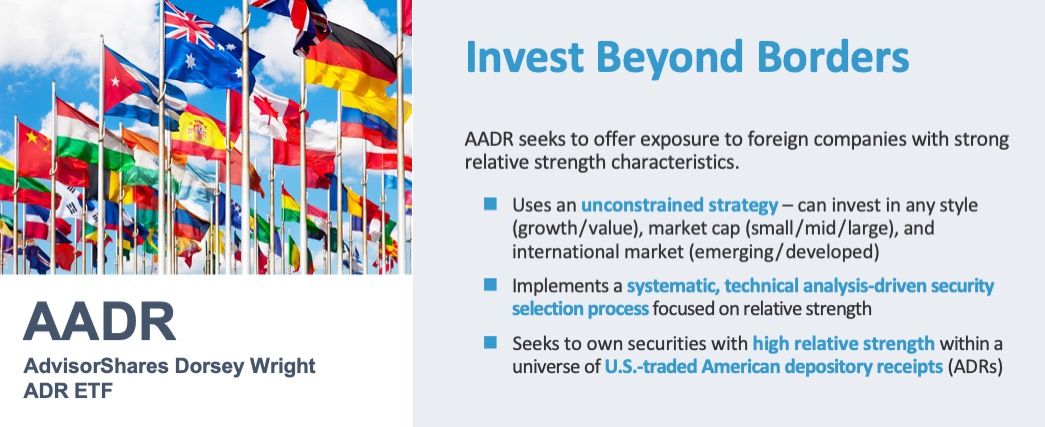
<strong>About The ETF</strong>
The AdvisorShares Dorsey Wright ADR ETF (AADR) is an actively managed ETF using a technically driven investment strategy to offer international equity exposure to developed and emerging markets while seeking long-term capital appreciation. AADR uses Nasdaq Dorsey Wright’s (NDW) proprietary relative strength methodology to structure a portfolio of international companies that trade in the U.S. via American depository receipts (ADRs). In selecting securities for its portfolio, AADR is unconstrained by investment style, market capitalization, and developed or emerging markets.
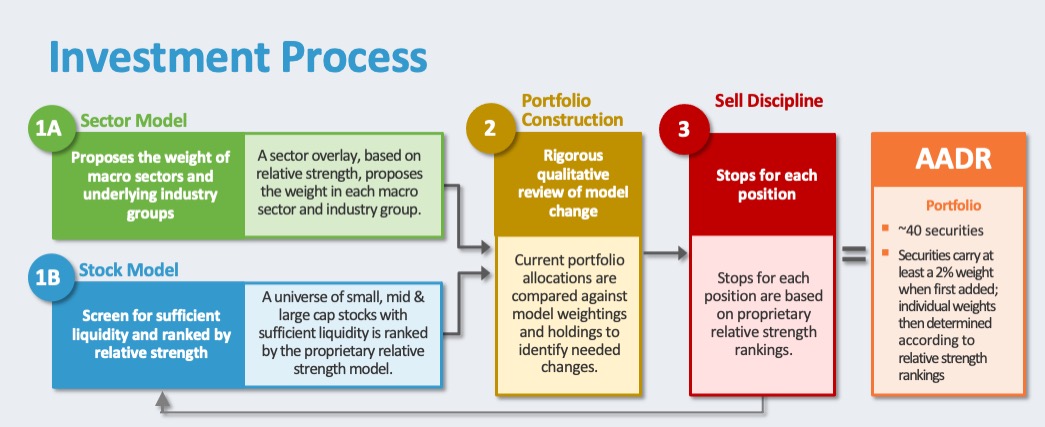
To implement AADR’s strategy, relative strength is measured across macroeconomic sectors and international equities. AADR’s technically driven investment process seeks to buy international equities demonstrating high relative strength within their universe and hold them until they exhibit sell signals. This approach is purely systematic, removing human emotion from day-to-day decision making.
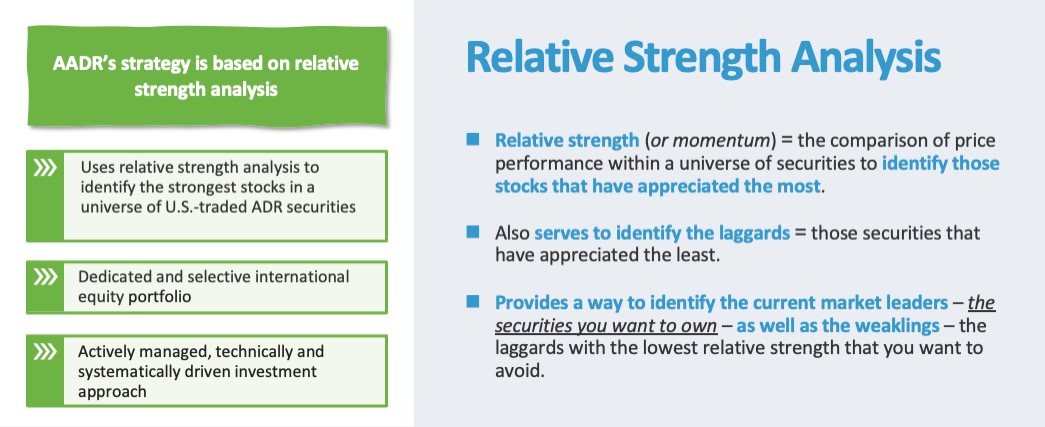
<strong>What Is Relative Strength?</strong>
Relative strength is a way of recording historic performance patterns to identify momentum signals for current and future performance trends of a security versus an investment universe or benchmark. It is the comparison of price performance within a universe of securities to identify those that have appreciated the most. Numerous studies by both academics and investment professionals have demonstrated that securities showing the greatest gains relative to their market often continue to outperform. Analyzing securities by their relative strength provides a way to identify the current market leaders – the securities you want to own – as well as the weaklings – the laggards with the highest relative weakness that you want to avoid. NDW is recognized as a leader in relative strength analysis.
<strong>What are ADRs?</strong>
An American depositary receipt (ADR) is a negotiable U.S. security that generally represents a company’s publicly traded equity or debt. Depositary receipts are created when a broker purchases a non-U.S. company’s shares on its home stock market and delivers the shares to the depositary’s local custodian bank, and then instructs the depositary bank such as BNY Mellon, to issue depositary receipts.
<strong>Why Invest?</strong>
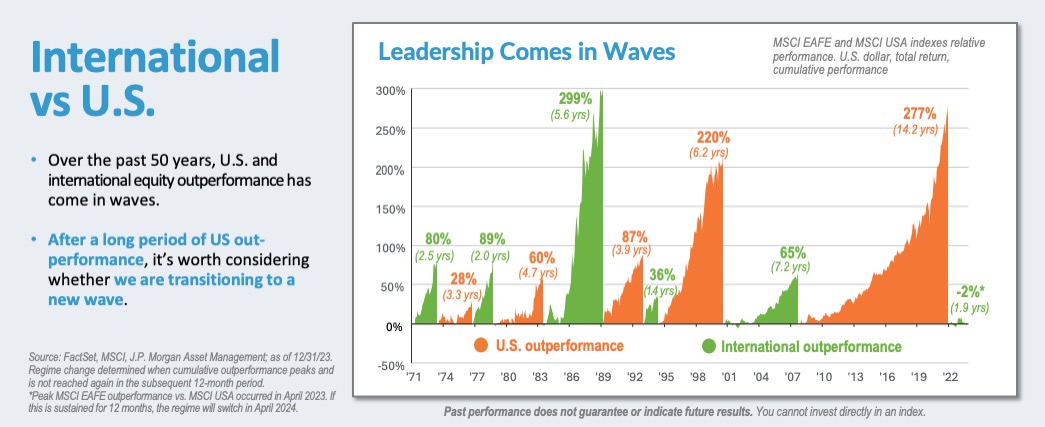
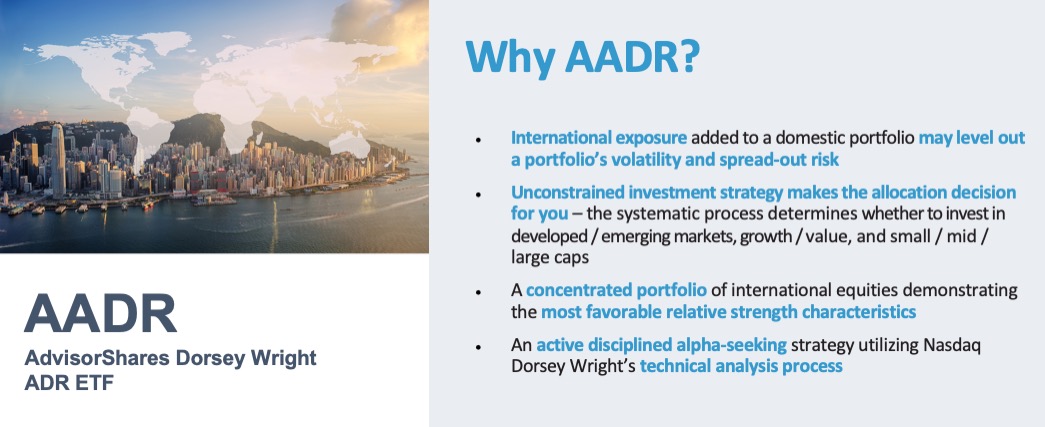
- International Exposure – Markets outside the U.S. don’t always rise and fall at the same time as the domestic market. Owning pieces of both international and domestic securities may level out some of a portfolio’s volatility and spread out risk more than if just holding domestic securities.
- Concentrated Portfolio – AADR typically has a portfolio of up to 40 equities that demonstrate the most favorable relative strength characteristics according to NDW’s technical analysis process.
- Unconstrained Stock Selection – AADR can go where it finds relative strength in the international markets. It is unconstrained by style (growth / value), investment capitalization (small / mid / large), or even classification of international market (emerging / developed).
- Sector Risk Management – AADR’s systematic investment strategy takes several factors into account to limit unnecessary risk and maximize exposure to the relative strength factor. The process spreads the allocation among multiple sectors – limiting the allocation to each based on the sector’s size – and within the sector’s industry groups, if possible.
- Disciplined Strategy – AADR actively looks to add alpha with a systematic, technical analysis-driven process that seeks to own the strongest growth-momentum companies while avoiding the weakes Securities are automatically sold from the portfolio when they fall below a predetermined rank threshold.
- Potential Tax Advantage – While AADR has an actively managed strategy, including disciplined monthly rebalancing, the unique tax-efficient, in-kind creation/redemption process of the ETF structure helps AADR’s management to manage or eliminate capital gains exposure and reduce costs.
<strong>Where Can AADR Fit in a Traditional Portfolio?</strong>
AADR can serve as an alpha-seeking complement to a broad-based international index fund or as a stand-alone investment solution for international equity exposure.
<strong>Key Attributes</strong>
- Concentrated Portfolio of Highly-Ranked Equities – AADR typically has a portfolio of less than 40 equities that demonstrate high relative strength characteristics according to NDW’s proprietary macroeconomic sector ranking and individual stock rotation methodology.
- Flexible International Portfolio – AADR’s strategy allows it to invest where it finds the best relative strength regardless of style (value or growth), investment capitalization (small, mid, or large), or classification of international market (emerging or developed).
- Systematic Approach – AADR’s investment process is entirely systematic and designed to remove human emotion from the decision process. It allows for the ongoing analysis of a large universe of securities through diverse and changing markets.
- Relative Strength Analysis – AADR uses relative strength which compares price performance within a universe of stocks. Relative strength investing provides a repeatable process to identify and select the leaders while avoiding the laggards. It is important to be equally good at identifying both long-term winners and losers.
- Disciplined Sell Process – Securities are automatically sold from the portfolio when they fall below a predetermined rank threshold. The sell rank is determined when the security is purchased and not adjusted for different market scenarios. The sell process does not allow for human discretion or overrides.
<strong>About the Portfolio Strategist</strong>
John G. Lewis, CMT | Nasdaq Dorsey Wright, Senior Portfolio Manager
Since joining Nasdaq Dorsey Wright in 2002, Mr. Lewis has developed relative strength and momentum strategies for the firm’s separately managed accounts, global asset allocation strategies, ETFs, and UITs. As one of the foremost experts on relative strength investing, Mr. Lewis has authored several original research papers on the subject. He is a Chartered Market Technician (CMT) and a member of the Market Technician’s Association and the American Association of Professional Technical Analysts. Mr. Lewis earned an M.B.A. in Finance from the University of Southern California and a B.A. from the University of San Diego. He began his career in the investment industry in 1994.
Chuck Fuller, CFA, CMT | Nasdaq Dorsey Wright, Portfolio Manager
In his role as Portfolio Manager with Nasdaq Dorsey Wright, Mr. Fuller helps run SMA/UMA strategies and several ETF and mutual fund offerings. He is responsible for designing, analyzing, and implementing the firm’s investment strategies and has authored white papers on the use of Nasdaq Dorsey Wright’s technical attributes to manage portfolios. Mr. Fuller joined Nasdaq Dorsey Wright in 2007 and holds the Chartered Financial Analyst (CFA) and Chartered Market Technician (CMT) designations. He earned an M.B.A. from Virginia Tech and a B.S. in Computer Science from VCU.
Fund
Price History
Fund Data
4/18/2024| NAV | $59.56 |
| Change | $-0.19 |
| Shares Outstanding | 425,000 |
| Assets Under Management | $25,313,977.58 |
Market Data
4/18/2024| Closing Price | $59.84 |
| Close Change | $0.07 |
| Volume | 599 |
Regulatory Data
4/18/2024| Premium Discount | $0.02 |
| 30-Day Median bid-ask Spread | 0.004628 |
Shares are bought and sold at market price (closing price) not NAV and are not individually redeemed from the Fund. Market price returns are based on the midpoint of the bid/ask spread at 4:00 pm Eastern Time (when NAV is normally determined), and do not represent the return you would receive if you traded at other times.
FUND
Characteristics
As of 3/31/2024
AADR Emerging vs Developed
Source: Morningstar & AdvisorShares
AADR Country Allocation
FUND
Performance
As of 3/31/2024
| NAV | Market Price Return | MSCI EAFE Index | |
|---|---|---|---|
| 1 Month | 6.69 | 6.60 | 3.29 |
| 3 Months | 10.95 | 10.69 | 5.78 |
| YTD | 10.95 | 10.69 | 5.78 |
| 1 Year | 29.45 | 30.12 | 15.32 |
| 3 Years | 1.68 | 1.66 | 4.78 |
| 5 Years | 7.69 | 7.70 | 7.33 |
| 10 Years | 6.05 | 6.02 | 4.80 |
| Since Inception (7/20/2010, Annualized) | 7.75 | 7.74 | 6.62 |
As of 3/31/2024
| NAV | Market Price Return | MSCI EAFE Index | |
|---|---|---|---|
| 1 Month | 6.69 | 6.6 | 3.29 |
| 3 Months | 10.95 | 10.69 | 5.78 |
| YTD | 10.95 | 10.69 | 5.78 |
| 1 Year | 29.45 | 30.12 | 15.32 |
| 3 Years | 1.68 | 1.66 | 4.78 |
| 5 Years | 7.69 | 7.7 | 7.33 |
| 10 Years | 6.05 | 6.02 | 4.8 |
| Since Inception (7/20/2010, Annualized) | 7.75 | 7.74 | 6.62 |
Performance data quoted represents past performance and is no guarantee of future results. All Fund data and performance data quoted is believed to be accurate, and unless otherwise stated, is sourced from the Fund administrator, the Advisor’s or Sub-Advisor’s proprietary data, and Morningstar. Current performance may be lower or higher than the performance data quoted. Investment return and principal value will fluctuate so that an investor’s shares, when redeemed, may be worth more or less than original cost. Returns less than one year are not annualized.
The performance for periods before 09/01/16 is for the AdvisorShares WCM/BNY Mellon Focused Growth ADR ETF (the “Predecessor Fund”) which was renamed the AdvisorShares Dorsey Wright ADR ETF on 09/01/16. The Predecessor Fund had different portfolio managers and investment strategy than the Dorsey Wright ADR ETF. Performance prior to 09/01/16 reflects the Fund’s performance prior to the change in manager and investment strategy and may not be indicative of the Fund’s performance under the new manager and revised investment strategy. Performance since 09/01/16 reflects actual Dorsey Wright ADR ETF performance.
The MSCI EAFE Index is an unmanaged free float-adjusted market capitalization index that is designed to measure the equity market performance of developed markets, excluding the US & Canada. One cannot invest directly in an index.
The BNY Mellon Classic ADR Index combines the over the counter (OTC) traded ADRs with exchange-listed ADRs bringing transparency to the available universe of American Depositary Receipts, including those issued by many of the world’s premier companies. One cannot invest directly in an index.
| Date | Account Symbol | Stock Ticker | Security ID | Security Description | Shares | Share Price | Market Value | Portfolio Weight | Asset Group |
|---|---|---|---|---|---|---|---|---|---|
| 04/18/2024 | AADR | NVO | 670100205 | NOVO-NORDISK A/S-SPONS ADR | 13,488.00 | 122.75 | 1,655,652.00 | 6.54% | FS |
| YPF | 984245100 | YPF S.A.-SPONSORED ADR | 57,438.00 | 19.07 | 1,095,342.66 | 4.33% | FS | ||
| EDU | 647581206 | NEW ORIENTAL EDUCATIO-SP ADR | 12,109.00 | 86.89 | 1,052,151.01 | 4.16% | FS | ||
| ABBNY | 000375204 | ABB LTD-SPON ADR | 18,641.00 | 48.37 | 901,665.17 | 3.56% | FS | ||
| UBS | H42097107 | UBS GROUP AG-REG | 30,513.00 | 28.12 | 858,025.56 | 3.39% | FS | ||
| BBVA | 05946K101 | BANCO BILBAO VIZCAYA-SP ADR | 78,204.00 | 10.96 | 857,115.84 | 3.39% | FS | ||
| MUFG | 606822104 | MITSUBISHI UFJ FINL-SPON ADR | 87,458.00 | 9.78 | 855,339.24 | 3.38% | FS | ||
| BAESY | 05523R107 | BAE SYSTEMS PLC -SPON ADR | 12,246.00 | 65.1 | 797,214.60 | 3.15% | FS | ||
| BMA | 05961W105 | BANCO MACRO SA-ADR | 16,245.00 | 48.31 | 784,795.95 | 3.10% | FS | ||
| ERJ | 29082A107 | EMBRAER SA-SPON ADR | 31,860.00 | 24.22 | 771,649.20 | 3.05% | FS | ||
| GGAL | 399909100 | GRUPO FINANCIERO GALICIA-ADR | 27,386.00 | 28.03 | 767,629.58 | 3.03% | FS | ||
| CX | 151290889 | CEMEX SAB-SPONS ADR PART CER | 94,843.00 | 8.08 | 766,331.44 | 3.03% | FS | ||
| RELX | 759530108 | RELX PLC - SPON ADR | 17,586.00 | 41.43 | 728,587.98 | 2.88% | FS | ||
| HMY | 413216300 | HARMONY GOLD MNG-SPON ADR | 79,695.00 | 9.12 | 726,818.40 | 2.87% | FS | ||
| ASX | 00215W100 | ASE TECHNOLOGY HOLDING -ADR | 67,301.00 | 10.35 | 696,565.35 | 2.75% | FS | ||
| TOELY | 889110102 | TOKYO ELECTRON LTD-UNSP ADR | 5,899.00 | 116.47 | 687,056.53 | 2.71% | FS | ||
| SAP | 803054204 | SAP SE-SPONSORED ADR | 3,791.00 | 178.64 | 677,224.24 | 2.68% | FS | ||
| FMX | 344419106 | FOMENTO ECONOMICO MEX-SP ADR | 5,625.00 | 119.07 | 669,768.75 | 2.65% | FS | ||
| KOF | 191241108 | COCA-COLA FEMSA SAB-SP ADR | 6,980.00 | 93.24 | 650,815.20 | 2.57% | FS | ||
| PAM | 697660207 | PAMPA ENERGIA SA-SPON ADR | 15,249.00 | 41.89 | 638,780.61 | 2.52% | FS | ||
| NMR | 65535H208 | NOMURA HOLDINGS INC-SPON ADR | 107,105.00 | 5.87 | 628,706.35 | 2.48% | FS | ||
| TNP | G9108L173 | TSAKOS ENERGY NAVIGATION LTD | 25,601.00 | 24.53 | 627,992.53 | 2.48% | FS | ||
| PBR | 71654V408 | PETROLEO BRASILEIRO-SPON ADR | 38,796.00 | 15.58 | 604,441.68 | 2.39% | FS | ||
| SIEGY | 826197501 | SIEMENS AG-SPONS ADR | 6,490.00 | 92.95 | 603,245.50 | 2.38% | FS | ||
| ING | 456837103 | ING GROEP N.V.-SPONSORED ADR | 37,419.00 | 16.04 | 600,200.76 | 2.37% | FS | ||
| SMFG | 86562M209 | SUMITOMO MITSUI-SPONS ADR | 50,488.00 | 11.14 | 562,436.32 | 2.22% | FS | ||
| MELI | 58733R102 | MERCADOLIBRE INC | 409 | 1,370.25 | 560,432.25 | 2.21% | FS | ||
| AVDL | G29687103 | AVADEL PHARMACEUTICALS-ADR | 31,765.00 | 17.38 | 552,075.70 | 2.18% | FS | ||
| NXPI | N6596X109 | NXP SEMICONDUCTORS NV | 2,444.00 | 219.35 | 536,091.40 | 2.12% | FS | ||
| LOGI | H50430232 | LOGITECH INTERNATIONAL-REG | 6,765.00 | 78.08 | 528,211.20 | 2.09% | FS | ||
| CMPGY | 20449X401 | COMPASS GROUP PLC-SPON ADR | 18,138.00 | 26.9 | 487,912.20 | 1.93% | FS | ||
| E | 26874R108 | ENI SPA-SPONSORED ADR | 14,537.00 | 32.13 | 467,073.81 | 1.85% | FS | ||
| HESAY | 42751Q105 | HERMES INTL-UNSPONSORED ADR | 1,882.00 | 247.32 | 465,456.24 | 1.84% | FS | ||
| VIPS | 92763W103 | VIPSHOP HOLDINGS LTD - ADR | 30,105.00 | 15.15 | 456,090.75 | 1.80% | FS | ||
| VIV | 87936R205 | TELEFONICA BRASIL-ADR | 46,170.00 | 9.27 | 427,995.90 | 1.69% | FS | ||
| ELP | 20441B605 | COMPANHIA PARANAENSE DE ENER | 29,789.00 | 7.08 | 210,906.12 | 0.83% | FS | ||
| ELPC | 20441B704 | CIA PARANAENSE DE ENER-ADR | 7,386.00 | 6.29 | 46,457.94 | 0.18% | FS | ||
| X9USDAIMP | INVESCO GOVT AGENCY PRIV 1903 | 294,122.17 | 1 | 294,122.17 | 1.16% | MM | |||
| CASH | 12,177.80 | 100 | 12,177.80 | 0.05% | CA |
FUND
Fees & Expenses
| Management Fee | 0.75% |
| Total Annual Operating Expenses | 1.15% |
| Fee Waiver/Expense Reimbursement(a) | -0.05% |
| Total Annual Operating Expenses After Fee Waiver/Expense Reimbursement | 1.10% |
(a) The Advisor has contractually agreed to keep net expenses from exceeding 1.10% of the Fund’s average daily net assets for at least one year from the date of the prospectus. For more information, please read the full prospectus.
Last Ten
Fund Distributions
- Before investing you should carefully consider the Fund’s investment objectives, risks, charges, and expenses. This and other information is in the prospectus or summary prospectus, a copy of which may be obtained by visiting the Fund’s website at www.AdvisorShares.com. Please read the prospectus carefully before you invest. Foreside Fund Services, LLC, distributor.
There is no guarantee that the Fund will achieve its investment objective. An investment in the Fund is subject to risk, including the possible loss of the principal amount invested. Emerging Markets, which consist of countries or markets with low to middle income economies can be subject to greater social, economic, regulatory, and political uncertainties and can be extremely volatile. Other Fund risks include concentration risk, foreign securities, and currency risk, ADRs which may be less liquid, large-cap risk, early closing risk, counterparty risk and trading risk, which can increase Fund expenses and may decrease Fund performance. The Fund is, also, subject to the same risks associated with the underlying ETFs, which can result in higher volatility.
This Fund may not be suitable for all investors. See the prospectus or summary prospectus for details regarding risk.
Definitions:
Alpha: One of the most commonly quoted indicators of investment performance, alpha, is defined as the excess return on an investment relative to the return on a benchmark index.
ETF Social Conversation